
SLIDE 1
Isle of Dogs SMALL MULTIPLES FOR MAPS head (opiates) ## # A - - PowerPoint PPT Presentation
Isle of Dogs SMALL MULTIPLES FOR MAPS head (opiates) ## # A tibble: 6 x 10 ## Year State FIPS Deaths Population Crude Adjusted ## <int> <chr> <int> <int> <int> <dbl> <dbl> ## 1
head(opiates) ## # A tibble: 6 x 10 ## Year State FIPS Deaths Population Crude Adjusted ## <int> <chr> <int> <int> <int> <dbl> <dbl> ## 1 1999 Alabama 1 37 4430141 0.8 0.8 ## 2 1999 Alaska 2 27 624779 4.3 4.0 ## 3 1999 Arizona 4 229 5023823 4.6 4.7 ## 4 1999 Arkansas 5 28 2651860 1.1 1.1 ## 5 1999 California 6 1474 33499204 4.4 4.5 ## 6 1999 Colorado 8 164 4226018 3.9 3.7 ## # ... with 3 more variables: Adjusted.se <dbl>, ## # Region <ord>, Abbr <chr>
p0 <- ggplot(data = opiates_map, aes(x = long, y = lat, group = group, fill = cut_interval(Adjusted, n = 5))) p1 <- p0 + geom_polygon(color = "lightblue", size = 0.2) + coord_map(projection = "albers", lat0 = 39, lat1 = 45) p2 <- p1 + scale_fill_brewer(type = "seq", palette = "Oranges") p2 + theme_map() + facet_wrap(~ Year, ncol = 3) + guides(fill = guide_legend(nrow = 1)) + theme(legend.position = "bottom", strip.background = element_blank()) + labs(fill = "Death rate per 100,000 population", title = "Opiate Related Deaths by State, 1999-2014")
p0 <- ggplot(data = opiates, mapping = aes(x = Year, y = Adjusted)) p1 <- p0 + geom_line(color = "gray85", mapping = aes(group = State))
p2 <- p1 + geom_smooth(mapping = aes(group = Region), se = FALSE)
p3 <- p2 + geom_text_repel(data = subset(opiates, Year == max(Year) & Abbr !="DC"), mapping = aes(x = Year, y = Adjusted, label = Abbr), size = 1.8, segment.color = NA, nudge_x = 30) + coord_cartesian(c(min(opiates$Year), max(opiates$Year)))
p3 + labs(x = "", y = "Rate per 100,000 population", title = "State-Level Opiate Death Rates by Region, 1999-2014") + facet_wrap(~ reorder(Region, Adjusted, na.rm = TRUE), nrow = 1)
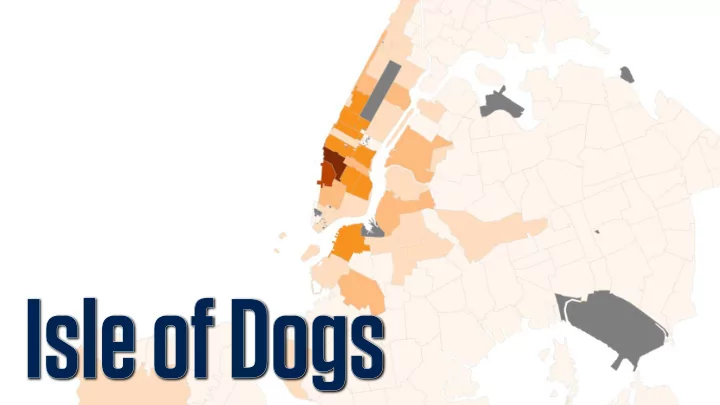
library(tidyverse) library(socviz) library(nycdogs) nyc_license
## # A tibble: 122,203 x 14 ## animal_name animal_gender animal_birth_mo…¦ breed_rc borough zip_code ## <chr> <chr> <date> <chr> <chr> <int> ## 1 Shadow M 2000-01-01 Beagle Brookl…¦ 11236 ## 2 Rocco M 2011-10-01 Boxer Brookl…¦ 11210 ## 3 Luigi M 2005-09-01 Maltese Bronx 10464 ## 4 Petunia F 2013-08-01 Pug Brookl…¦ 11221 ## 5 Romeo M 2008-10-01 Maltese Bronx 10451 ## 6 Brandy M 2004-01-01 Unknown Brookl…¦ 11225 ## 7 Sam M 2011-05-01 Pug Manhat…¦ 10021 ## 8 May F 2004-05-01 Unknown Staten…¦ 10305 ## 9 Ruby F 2010-04-01 Boxer Brookl…¦ 11220 ## 10 Leo M 2014-01-01 Beagle Bronx 10468 ## # …¦ with 122,193 more rows, and 8 more variables: community_district <dbl>, ## # census_tract2010 <dbl>, nta <chr>, city_council_district <dbl>, ## # congressional_district <dbl>, state_senatorial_district <dbl>, ## # license_issued_date <date>, license_expired_date <date>
boro_names <- c("Manhattan", "Queens", "Brooklyn", "Bronx", "Staten Island") no_name <- c("Unknown", "Name Not Provided")
nyc_license %>% filter(borough %in% boro_names, animal_name %nin% no_name, animal_gender %nin% NA) %>% group_by(borough, animal_name) %>% tally() %>% mutate(prop = n/sum(n)) %>% arrange(desc(prop)) %>% slice_max(n = 10, order_by = prop) %>% ggplot(mapping = aes(x = prop, y = reorder(animal_name, prop))) + geom_point(size = 2) + scale_x_continuous(labels = scales::percent) + facet_wrap(~ reorder(borough, -prop), scales = "free_y", nrow = 1) + labs(x = "Percent", y = NULL) + theme_minimal()