
SLIDE 1
NYSE: AWK
Investor Presentation
August 2018
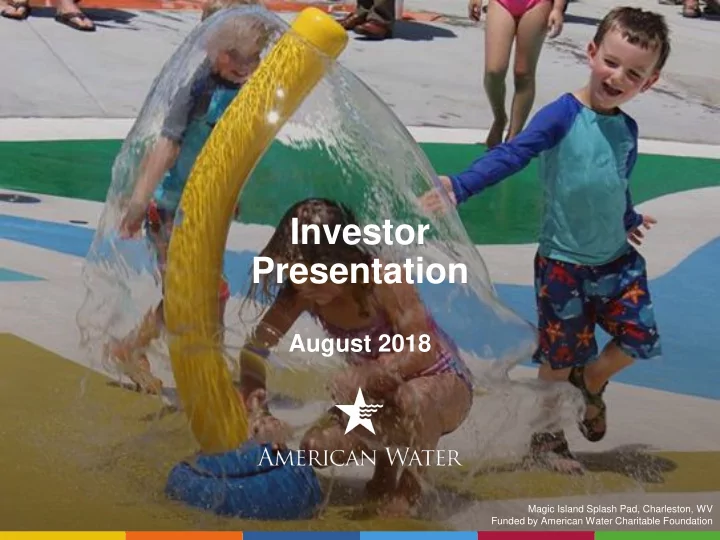
Magic Island Splash Pad, Charleston, WV Funded by American Water Charitable Foundation
Investor Presentation August 2018 Magic Island Splash Pad, - - PowerPoint PPT Presentation
Investor Presentation August 2018 Magic Island Splash Pad, Charleston, WV NYSE: AWK Funded by American Water Charitable Foundation Forward-Looking Statements Certain statements in this presentation including, without limitation, 2018 earnings
NYSE: AWK
Magic Island Splash Pad, Charleston, WV Funded by American Water Charitable Foundation
NYSE: AWK
www.amwater.com 2
August 2018 Certain statements in this presentation including, without limitation, 2018 earnings guidance, projected long-term earnings and dividend growth, the level of future capital expenditures, estimates regarding
projected impacts of the Tax Cuts and Jobs Act (the “TCJA”) on our business, results of operations, cash flows and liquidity, and the estimated revenues from rate cases and other government agency authorizations, are forward-looking statements within the meaning of the safe harbor provisions of the Private Securities Litigation Reform Act of 1995 and the Federal securities laws. In some cases, these forward-looking statements can be identified by words with prospective meanings such as “intend,” “plan,” “estimate,” “believe,” “anticipate,” “expect,” “predict,” “project,” “propose,” “assume,” “forecast,” “outlook,” “future,” “pending,” “goal,” “objective,” “potential,” “continue,” “seek to,” “may,” “can,” “will,” “should” and “could” and or the negative of such terms or other variations or similar
financial results of levels of activity, performance or achievements, and readers are cautioned not to place undue reliance upon them. The forward-looking statements are subject to a number of estimates and assumptions, and known and unknown risks, uncertainties and other factors. Actual results may differ materially from those discussed in the forward-looking statements included in this press release as a result of the factors discussed in our Annual Report on Form 10-K for the year ended Dec. 31, 2017, and subsequent filings with the SEC, and because of factors such as: the decisions of governmental and regulatory bodies, including decisions to raise or lower customer rates; the timeliness and outcome of regulatory commissions’ actions concerning rates, capital structure, authorized return on equity, capital investment, system acquisitions, taxes, permitting and other decisions; changes in customer demand for, and patterns of use of, water, such as may result from conservation efforts; limitations on the availability of our water supplies or sources of water, or restrictions on our use thereof, resulting from allocation rights, governmental or regulatory requirements and restrictions, drought, overuse or other factors; changes in laws, governmental regulations and policies, including with respect to environmental, health and safety, water quality and emerging contaminants, public utility and tax regulations and policies, and impacts resulting from U.S., state and local elections; weather conditions and events, climate variability patterns, and natural disasters, including drought or abnormally high rainfall, prolonged and abnormal ice or freezing conditions, strong winds, coastal and intercoastal flooding, earthquakes, landslides, hurricanes, tornadoes, wildfires, electrical storms and solar flares; the outcome of litigation and similar governmental proceedings, investigations or actions, including matters related to the Freedom Industries chemical spill in West Virginia and the preliminarily approved global class action settlement agreement related to this chemical spill; our ability to appropriately maintain current infrastructure, including our operational and information technology (“IT”) systems, and manage the expansion of our business; exposure or infiltration of our critical infrastructure, operational technology and IT systems, including the disclosure of sensitive or confidential information contained therein, through physical or cyber attacks or other means; our ability to obtain permits and other approvals for projects; changes in our capital requirements; our ability to control operating expenses and to achieve efficiencies in our operations; the intentional or unintentional actions of a third party, including contamination of our water supplies or water provided to our customers; our ability to obtain adequate and cost-effective supplies of chemicals, electricity, fuel, water and other raw materials that are needed for our operations; our ability to successfully meet growth projections for our business and capitalize on growth opportunities, including our ability to, among other things, acquire and integrate water and wastewater systems into our regulated operations, and enter into contracts and other agreements with, or otherwise obtain, new customers in our market-based businesses; risks and uncertainties associated with contracting with the U.S. government, including ongoing compliance with applicable government procurement and security regulations; cost overruns relating to improvements in or the expansion of our operations; our ability to maintain safe work sites; our exposure to liabilities related to environmental laws and similar matters resulting from, among other things, water and wastewater service provided to customers, including, for example, our water service and management solutions that are focused on customers in the shale natural gas exploration and production market; changes in general economic, political, business and financial market conditions; access to sufficient capital on satisfactory terms and when and as needed to support operations and capital expenditures; fluctuations in interest rates; restrictive covenants in or changes to the credit ratings on us or our current or future debt that could increase our financing costs or funding requirements or affect our ability to borrow, make payments on debt or pay dividends; fluctuations in the value of benefit plan assets and liabilities that could increase our cost and funding requirements; changes in federal or state general, income and other tax laws, including any further rules, regulations, interpretations and guidance by the U.S. Department of the Treasury and state or local taxing authorities related to the enactment of the TCJA, the availability of tax credits and tax abatement programs, and our ability to utilize our U.S. federal and state income tax net operating loss carryforwards; migration of customers into or out of our service territories; the use by municipalities of the power of eminent domain or other authority to condemn our systems, or the assertion by private landowners of similar rights against us; difficulty or inability to obtain insurance, the inability to obtain insurance at acceptable rates and on acceptable terms and conditions, or an inability to obtain reimbursement under existing insurance programs for any losses sustained; the incurrence of impairment charges related to our goodwill or other assets; labor actions, including work stoppages and strikes; the ability to retain and attract qualified employees; civil disturbances or terrorist threats or acts, or public apprehension about future disturbances or terrorist threats or acts; the occurrence of the benefits and synergies expected or predicted to occur as a result of the completion of the acquisition of Pivotal Home Solutions; unexpected costs, liabilities or delays associated with this acquisition or the integration of Pivotal’s business; and the impact of new, and changes to existing, accounting standards. These forward-looking statements are qualified by, and should be read together with, the risks and uncertainties set forth above and the risk factors included in our annual and quarterly SEC filings, and readers should refer to such risks, uncertainties and risk factors in evaluating such forward-looking statements. Any forward-looking statements speak only as of the date of this presentation. We do not have or undertake any obligation or intention to update or revise any forward-looking statement, whether as a result of new information, future events, changed circumstances or otherwise, except as
which any factor, or combination of factors, may cause results to differ materially from those contained in any forward-looking statement. The foregoing factors should not be construed as exhaustive.
NYSE: AWK
www.amwater.com 3
August 2018
Clear, Transparent Story into the Future Demonstrated Execution of Strategy Low Risk, Regulated Water Utility Commitment to Shareholders
Decades of infrastructure investment needed Fragmented national water and wastewater landscape Line of sight to $8.4-$9.0 billion of 5 year capex (includes Pivotal acquisition) Capital-light MBB leverages core competencies, generates cash Five year TSR of 175% Long-term growth expected in top half of 7-10%* target EPS CAGR guidance through 2022 including Pivotal acquisition and tax reform “A/A3” credit rating with strong balance sheet Continuing to be more efficient in both O&M and capital costs Leader in water quality and R&D Multi-decade capital deployment needed Hundreds of water projects per year reducing risk of single projects Multiple state regulatory jurisdictions reduce both weather and regulatory risks Enabling legislation and mechanism to support regulated investment Six year dividend growth CAGR of ~10% Guided to 2018-2022 Dividend Growth at top end of 7-10%* EPS growth CAGR A leading investment in Environmental, Social Responsibility and Governance factors
* Anchored off of 2016 Adjusted EPS (a non-GAAP measure)
NYSE: AWK
www.amwater.com 4
August 2018
AWK Members of:
between $8.4 billion and $9.0 billion of 5 year total capital investment (includes Pivotal acquisition), to address aging infrastructure, reduce/eliminate leaks, improve cyber/physical security, and increase resiliency of critical assets to climate variability
2025 from 2007 baseline, after achieving 26% reduction through 2017
gallons through conservation
annually and producing reuse water at 30 of
dedicated to research and partnering with water research foundations, on water quality and technology
to support effective environmental, health and safety, and water quality standards and regulations
training
industry
Diverse Suppliers
company-sponsored events
giving campaigns with the United Way and Water For People, as well as supporting our employees’
Water Charitable Foundation
characterized by respect and dignity of every employee through “tone at the top” and required training
formalized employee action teams
46% of workforce is in jobs represented by unions
more than 50% of transfers/promotions filled by minority, female, veteran or disabled individuals
companies in 2017; 50% female as of March 2018
independent, non-executive chair
director tenure is 6.0 years as of March 1, 2018; 5 of 8 directors < 4 years’ tenure
times in 2017
education program with dedicated funding
management and board engagement
requirements: aligns with long-term interests of our stockholders
employees through off-site board meetings, external stakeholder reception, and meetings with “high potential” leaders
Socially Responsible Governance Environmental
NYSE: AWK
www.amwater.com 5
August 2018
* Anchored off of 2016 Adjusted EPS (a non-GAAP measure) ** Subject to board approval
Maintaining our estimated $8.4 - $9.0 billion five year capital investment No equity needed under normal operating conditions in current plan Expected to deliver in top half of 7-10%* target EPS CAGR guidance through 2022
Growing our dividend at high end of
targeted long-term 7 – 10%* EPS CAGR** Continuing improvement in O&M efficiency for customer affordability, flat adjusted O&M expense 2012 compared to last twelve months 2018
Long-term Highlights 2018 - 2022 Plan 7-10%* EPS CAGR
NYSE: AWK
NYSE: AWK
www.amwater.com 7
August 2018
7
In USA, over 20%—or 2 trillion gallons—of treated water is lost each year… By 2020, 44% of U.S. pipe infrastructure to be classified as poor, very poor, or life elapsed… Approximately 53,000 water systems, 17,000 wastewater systems
900 billion gallons of untreated sewage is discharged every year into U.S. rivers, streams and
American Society of Civil Engineers (ASCE) Grades US Infrastructure
* Not American Water Pipes
Aging infrastructure still has wooden pipes!*
NYSE: AWK
www.amwater.com 8
August 2018
Hurricane Irene, August 2011 Higher Flood Walls Under Construction
NYSE: AWK
www.amwater.com 9
August 2018
Connections
Delivered Daily
Our Regulated Footprint
Pennsylvania, 661 New Jersey, 739 Missouri, 289 Illinois, 304 Indiana, 222 California, 222 West Virginia, 144 Other, 377
2017 Regulated Revenues
(in Millions)
Pennsylvania, 722 New Jersey, 687 Missouri, 479 Illinois, 317 Indiana, 302 California, 178 West Virginia, 167 Other, 501
Total Customer Connections
As of December 31, 2017 (in Thousands)
NYSE: AWK
2018 - 2022
many small projects:
~40 projects per year
$15mm/project, ~3,500 projects per year
average is every 200 years
www.amwater.com 10
August 2018
2018-2022 Capital Expenditure by Category
(In $ Billions) $8.4 - $9.0
Regulated System Investments Regulated Acquisitions Other Capital Continued Smooth Deployment of Capital
$0.2 $0.6 - $1.2 $7.2
Pivotal
$0.4
NYSE: AWK
40.7% 36.7% 34.9% 0.3% 2.4% 1.6%
41.0% 39.1% 36.5% 36.3% 35.3% 32.0% 2012 2014 2016 LTM 2017 LTM 2018 2022 Target
Regulated O&M Efficiency Ratio Tax Reform Adjustment
* Non-GAAP Measure – See appendix for reconciliation. O&M Efficiency Ratio = Adjusted Regulated O&M Expenses (O&M Expenses is most comparable GAAP measure) / Adjusted Regulated operating Revenues (Operating Revenues is most comparable GAAP measure). This calculation assumes purchased water revenues approximate purchased water expenses ** A reconciliation to a most comparable forward-looking GAAP measure is not available without unreasonable effort *** The adjusted O&M efficiency ratio previously reported for the twelve months ended June 30, 2017 was 34.5%, which did not include the adjustments for the impact of the Company’s adoption of ASU 2017-07 on January 1, 2018 and the estimated impact of the TCJA
11
August 2018
**
Artificial icial Intellige elligence ce Machin hine e Learnin arning Water er Sourc urce e Monitorin itoring Smart t Sens nsor
work Drone nes Big Data a Analy lytics tics
***
Regulated O&M Efficiency Ratio* Adjusted Operations and Maintenance Expense
($ in millions)
$980 $943 $959 $969 2012 2014 2016 LTM 2018
NYSE: AWK
www.amwater.com 12
August 2018
IA IL IN MO NJ NY PA TN VA WV CA HI IL IN KY NY PA TN VA CA IL MD MO NJ NY PA TN VA WV IA IL IN KY MD MO NJ PA VA WV IL CA NY CA IL KY NY PA TN VA 15 New Regulatory Mechanisms Across Our Footprint Since 2010 NY
2 7 7 6 6 7 3 7 9 10 10 11 Revenue Stability Mechanisms Utility Plant Recovery Mechanisms Forward Looking Test Years Expense Mechanisms Infrastructure Replacement Surcharges Consolidated Tariffs As of 2010 As of 6/30/2018
NYSE: AWK
13
August 2018
Water Investor Owned 16%
Public & Other 84%
Wastewater Investor Owned 2%
Public & Other 98%
Industry Opportunity
Ideal Fit for Industry Consolidation Opportunities Target 5k – 30k Customer Connections Per Acquisition Wastewater Focus (Customer Connections Mix – 95% Water & 5% Wastewater)
American Water Footprint
NYSE: AWK
www.amwater.com 14
August 2018
California 1997
Fair Market Value
New Jersey 2015 & 2017
Fair Market Value Water Quality
Accountability Act
Pennsylvania 2012 & 2016
Water & Wastewater
Revenue Requirement Consolidation
Fair Market Value & Post
Acquisition Deferral
Missouri 2013
Fair Market Value
Illinois 2013
Fair Market Value & Post
Acquisition Deferrals
Indiana 2015, 2016 & 2018
Fair Market Value Fair Market Value Expansion Water Commitment Act
(SB 362)
Virginia 2017
Water Rate Consolidation Wastewater Rate
Consolidation
Iowa 2018
Fair Market Value
Maryland 2018
Fair Market Value
NYSE: AWK Closed 2015 – 24,056 Closed 2016 – 42,195 Closed 2017 – 39,664*** Closed 2018 (YTD August 1) – 5,607 Pending – ~57,000
www.amwater.com 15
August 2018
Feasible Opportunity
Other Factors
(i.e. positive private business, path to 50k customers in 5 yrs.)
AW Footprint & progressive regulatory climate ~10,000 systems serving > 3,000 customers 52,000 Community Water & Wastewater Systems *
* EPA’s 2015 national assessment and report to Congress ** Excludes organic growth customer connections *** This includes the McKeesport, PA acquisition, which represents 22,000 customers, due to bulk contracts. Connections to the system are approximately 11,000
American Water Acquisitions**
(Customer Connections)
NYSE: AWK
www.amwater.com 16
August 2018
Cash Flow Positive Businesses Help to Support Growth Leverage Size and Scale Managed Portfolio Risk Complementary water and wastewater services
Military Services Group Homeowners Services Group Keystone Three Primary Businesses
Leverage core competencies Capital light, cash positive Competitive culture
Market-Based Risk Characteristics
NYSE: AWK
NYSE: AWK www.amwater.com
17
TM
NYSE: AWK
Vice President, Investor Relations
edward.vallejo@amwater.com
Director, Investor Relations
ralph.jedlicka@amwater.com
NYSE: AWK
NYSE: AWK
3 states amortization deferred; 11 pending
www.amwater.com 20
August 2018
Regulatory Status of TCJA State Tax Changes
Missouri Kentucky Iowa New Jersey
6.25% to 4% in 2020
Income Tax Change
6% to 5% in 2018 Consolidated return 2019 12% to 9.8% in 2021 9% to 11.5% for 2018/19 10.5% for 2020/21
State Earnings Impact
TBD Illinois Pennsylvania Missouri New Jersey Iowa California New York Hawaii Tennessee Indiana Virginia Kentucky West Virginia Maryland
Customer Rates Adjusted
Offsets Capital Investments
Pending Excess ADIT
Tax Rate Change
Parent Earnings Impact
$3 million expense from state tax apportionment TBD 2Q 3Q Expected to benefit regulated customers
NYSE: AWK NYSE: AWK
$1.21 $1.33 $1.47 $1.62 $1.78
2014 2015 2016 2017 2018 E
Six Consecutive Years with ~10% Dividend Growth
* Future dividends are subject to approval of the American Water Board of DirectorsStrong Balance Sheet Disciplined Approach to Acquisitions Predominantly Regulated Business ≥ 85%
Top Quartile Dividend Growth with 50% – 60% Payout Ratio Smooth Capital Deployment
*
Consistent Earnings Growth
One Year Three Year Five Year American Water S&P 500 14.9% 34.4% 87.5% UTY Index 67.8% 137.1% 4.1% 29.5% 48.6% 10.4%
Total Shareholder Return (Price + Dividend)
August 2018
21
NYSE: AWK
www.amwater.com 22
August 2018
Prudent Investment Drives Need for Rate Cases
Operating Expenses Taxes, Depr & Amortization Weighted Average Cost
Establish Rate Base Allowed Return Allowed Return Revenue Requirement
Step 2 Step 1
American Water has experience in securing appropriate rates of return and promoting constructive regulatory frameworks
NYSE: AWK
23
August 2018
Date Effective Annualized Revenue Increases Effective in 2018 Infrastructure Charges West Virginia (DSIC) 1/1/2018 $3 Illinois (QIP) 1/1/2018 3 Virginia (WWISC) 3/1/2018 1 Indiana (DSIC) 3/14/2018 7 Tennessee (QIIP, EDI, SEC) 4/10/2018 1 $15 Rate Cases & Step Increases Pennsylvania 1/1/2018 $62 (a) Missouri 5/28/2018 33 (b) $95 Total $110
(a) The revenue increase from the PA GRC of $62 million does not include $42 million DSIC revenues that were effective in 2017. (b) The revenue increase from the MO GRC of $33 million does not include $5 million ISRS revenues that were effective in 2017.
www.amwater.com
NYSE: AWK
24
August 2018
Rate Cases Filed Revenue Increase Company Docket / Case Number Date Filed Adj for TCJA ROE Requested Rate Base California Case No. A.16-07-002 7/1/2016 $19 (a) NA $494 New Jersey Case No. WR-17090985 9/15/2017 $117 (b) 10.80% $3,025 West Virginia Case No. 18-0573-W-42T and 18-0576-S-42T 4/30/2018 $29 (c) 10.80% $653 Maryland 6/28/2018 $2 10.80% $28 Total Awaiting Final Order: $167 $4,200 Infrastructure Charges Filed West Virginia (DSIC) 6/29/2018 $2 $26 $2 $26 Total Awaiting Final Order: $169
(a) For this final application, Test Year 2018 revenue requirement request is $35 million above July 1, 2016 revenues. This excludes the step rate and attrition rate increase estimates for 2019 and 2020 of $9 million and $8 million, respectively. The total estimated revenue requirement increase request for the three year rate case cycle is $51 million. On October 10, 2016, the Company filed an update to our final general rate case application adjusting the 2018 request to $32 million of additional annualized revenues above July 1, 2016 revenues. It also includes estimated increases in the escalation year 2019 and the attrition year 2020 of $9 million and $8 million, respectively. On February 23, 2018, the Company filed a revised results of operations model in the general rate case application adjusting the 2018 request to $24 million above July 1, 2016 revenues to reflect the lower 2018 federal income tax rate. On April 6, 2018, the Company filed an update to reflect the Cost of Capital in its current case, the 2018 request was adjusted to $19 million. (b) New Jersey American filed supplemental testimony on February 8, 2018, as a result of the TCJA which reduced the request to $117 million. Effective April 1, 2018, New Jersey American complied with an order entered in the NJ BPU’s TCJA investigation proceeding requiring all utilities to tariff interim rates reflecting the new federal corporate tax rate of 21%. As a result of the order in the TCJA tax proceeding, New Jersey American reduced its revenues by $42.5 million. (c) The requested increase is $33 million, which includes $4 million from DSIC cases.
www.amwater.com
NYSE: AWK
Authorized Rate Base* $439,448 $883,386 $841,915 (b) $405,704 (b) $1,249,293 (b) Authorized ROE 9.20% (a) 9.79% 9.75% 9.70% (e) 10.00% (e) Authorized Equity 55.39% (a) 49.80% 41.55% (c) 47.36% (d) 52.80% (d) Effective Date of Rate Case 1/1/2018 (a) 1/1/2017 1/29/2015 8/28/2016 5/28/2018 Authorized Rate Base* $2,386,790 $275,463 $3,162,597 (b) $155,747 $529,212 Authorized ROE 9.75% 9.10% 10.00% (e) 9.25% 9.75% Authorized Equity 52.00% 46.00% 53.75% (d) 46.09% 45.84% Effective Date of Rate Case 9/21/2015 6/1/2017 1/1/2018 5/24/2017 (f) 2/25/2016 *Rate Base stated in $000s Notes: a) On March 22, 2018, Decision 18-03-035 set the authorized cost of capital for 2018 through 2020. CA has a separate Cost of Capital case which sets the rate of return outside of a general rate proceeding. b) The Rate Base listed is the Company's view of the Rate Base allowed in the case, the Rate Base was not disclosed in the Order or the applicable settlement agreement. c) Regulatory capital structure includes cost-free items or tax credit balances at the overall rate of return which lowers the equity percentage as an alternative to the common practice of deducting such items from rate base d) The equity ratio listed is the Company's view of the equity ratio allowed in the case, the actual equity ratio was not disclosed in the Order or the applicable settlement agreement. e) The ROE listed is the Company's view of the ROE allowed in the case, the ROE was not disclosed in the Order or the applicable settlement agreement. f) Interim rates were effective April 1, 2016 and received final Order May 24, 2017.
Last Rate Case Awarded - Largest Regulated Subsidiaries
www.amwater.com 25
August 2018
NYSE: AWK
* An approximation of rate base, which includes Net Utility Plant not yet included in rate base pending rate case filings/outcomes ** Includes the regulatory liability established to normalize the impact of tax rate changes under the Tax Cuts and Jobs Act
($ in millions)
www.amwater.com 26
August 2018
$9,398 $9,987 $10,694 $11,637 $12,007
As of 12/31/2014 As of 12/31/2015 As of 12/31/2016 As of 12/31/2017 As of 06/30/2018
Estimated Rate Base*
As of 06/30/2018 Net Utility Plant $16,463 Less Advances for Construction 263 CIAC – Contributions in Aid of Construction 1,298 Net Deferred income taxes** 2,873 Deferred investment tax credits 22 $4,456 Total Estimated Rate Base $12,007
NYSE: AWK
www.amwater.com 27
August 2018
Saving $1 in opex vs investing $8 in capital at allowed ROE, Keeps customer rates neutral and can create $0.39 in sustainable earnings
a) Revenue Requirement 1.00 $ 1.00 $ Expenses O&M 0.96
Depreciation
$
2
Interest Expense
$
3
Property & General Taxes 0.04
1
0.08 $
4
b) Total Expenses 1.00 0.47 $ c) Operating Income (=a-b)
$ d) Federal & State Income Taxes
$
5
e) Net Income to Shareholder (=c-d)
0.39 $
6
1 Assumes 4% taxes on revenue (gross receipts e.g.) 2 Assumes 2.5% depreciation expense 3 Assumes debt financing at 4.9% 4 Assumes property taxes on invested capital of 0.5% and revenue taxes of 4% 5 Assumes effective income tax rate of 26.1%, based on federal tax rate of 21% 6 Assumes authorized weighted average ROE of 9.8%Expense Savings Invested Capital $1 ~$8
NYSE: AWK
www.amwater.com 28
August 2018
State
Acquisitions Water Customers Wastewater Customers Total Customers Illinois 3 2,469 2,350 4,819 Kentucky 1 610
Missouri 2 50 128 178 Total 6 3,129 2,478 5,607 2018 Closed Acquisitions
State
Acquisitions Water Customers Wastewater Customers Total Customers Illinois 1
23,000 Pennsylvania 5 320 10,277 10,597 Indiana 4 7,415 1,250 8,665 California 4 8,629
New Jersey 1 3,945
Missouri 2 1,055 989 2,044 Total 17 21,364 35,516 56,880 Pending Acquisitions
NYSE: AWK
www.amwater.com 29
August 2018
* Calculation assumes purchased water revenues approximate purchased water expenses ** Calculation of Estimated tax reform = Revenue Requirement with new Effective Tax Rate (taxes grossed up) – Revenue Requirement with old Effective Tax Rate Regulated Segment O&M Efficiency Ratio (A Non-GAAP Unaudited Number)
($ in millions) Total operations and maintenance expense $1,330 $1,350 $1,504 $1,378 $1,487 $1,383 Less: Operations and maintenance expense – Market Based Operations 256 289 372 337 351 334 Operations and maintenance expense – Other (56) (51) (44) (50) (37) (40) Total operations and maintenance expense – Regulated Businesses $1,130 $1,112 $1,176 $1,091 $1,173 $1,089 Less: Regulated purchased water expense 110 122 122 128 123 133 Allocation of non-operation and maintenance expenses 35 39 30 29 27 29 Freedom Industries chemical spill in West Virginia
(22) 65 (42) Estimated impact of weather 5 (2)
$980 $943 $959 $956 $958 $969 Total operating revenues $2,854 $3,011 $3,302 $3,357 $3,332 $3,371 Less pro forma adjustment: Pro forma adjustment for impact of the TCJA
87 Total pro forma operating revenues $2,854 $3,011 $3,302 $3,357 $3,168 $3,284 Less: Operating Revenues – Market Based Operations 307 355 451 422 428 430 Operating Revenues – Other (17) (18) (20) (23) (22) (22) Total pro forma operating revenues – Regulated Businesses $2,564 $2,674 $2,871 $2,958 $2,762 $2,876 Less: Regulated Purchased Water expense* 110 122 122 128 123 133 Plus: Freedom Industries chemical spill in West Virginia
(47) 17
$2,407 $2,570 $2,749 $2,830 $2,639 $2,743 Adjusted O&M efficiency ratio—Regulated Businesses (a)/(b) 40.7% 36.7% 34.9% 33.8% 36.3% 35.3% Adjusted operations and maintenance expense – Regulated Businesses $980 $943 $959 $956 Less: Impact of adoption of ASU 2017-07 39 (8) 12 15 Adjusted operations and maintenance expense – Regulated Businesses (c) $941 $951 $947 $941 Adjusted operating revenues—Regulated Businesses $2,407 $2,570 $2,749 $2,830 Less pro forma adjustment: Pro forma adjustment for impact of the TCJA** 112 137 155 168 Adjusted pro forma operating revenues—Regulated Businesses (d) $2,294 $2,433 $2,594 $2,662 Adjusted O&M efficiency ratio—Regulated Businesses (c)/(d) 41.0% 39.1% 36.5% 35.4% FY 2014 LTM 2017 LTM 2018 FY 2016 FY 2017 FY 2012