
SLIDE 1
July 2020
01 October 2018
Investor Presentation 01 October 2018 Highlights 2020 1H - - PowerPoint PPT Presentation
July 2020 Investor Presentation 01 October 2018 Highlights 2020 1H highlights Production of 67.3 kboepd; safe and responsible operations maintained $240m of savings and deferrals (capex and opex) Solan P3 first oil by end Q3, adds
01 October 2018
Highlights
July 2020
ahead of August sailaway; first gas Q2 21, adding 20-25 kboepd post ramp-up
prospective exploration acreage retained
instruction received (July); 120 days to agree
subject to SPA finalisation, equity funding and agreed refi terms; adds c. 17 kboepd
to agree terms to a long term extension to our credit facilities by end July
waived through to end Sept 2020; forecast free cash flow positive for 2020 at forward curve
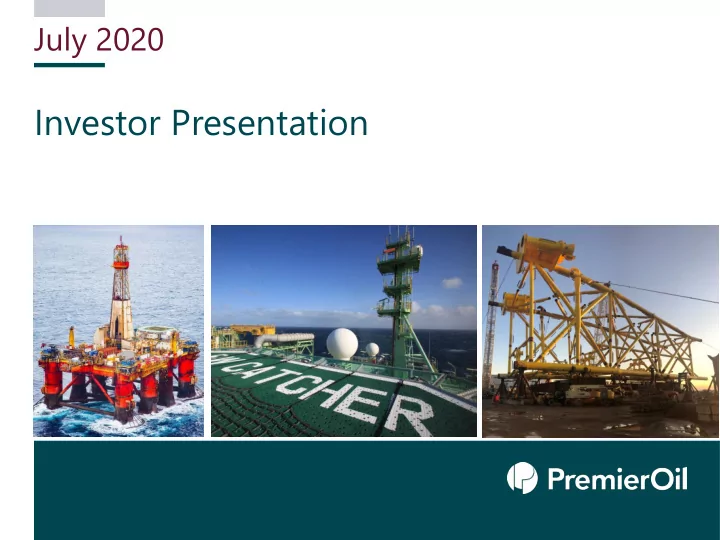
P1 Crew change at Catcher Transocean Leader drilling Solan P3 Castoro Sei laying pipe at Tolmount
Highlights
July 2020
Strong strategic rationale behind UK acquisitions
Status of UK acquisitions
terms and equity funding
Status of refinancing
covenants waived through to 30 September
term extension to Group’s credit facilities progressing
be recommended to full lender group for approval
P2
BP acquisitions to add c. 17 kboepd (net) in Q4 2020
Production
July 2020
2020 1H
– Solan P3, Varadero infill drilled – Catcher outage (now restored) – Huntington, Kyle COP
Premier operated sites
P3
Outlook
– Increased contribution from tax advantaged UK assets – Stable Asia production
assets to minimise emissions
Net debt
$m
SE Asia
23 kboepd
UK
47 kboepd
Operating efficiency1
% 20 40 60 80 100 2017 2018 2019 2020 1H Premier (Group) UKCS avg
1 Company estimates, Oil and Gas Authority data
1500 2000 2500 3000 2016 2017 2018 2019 2020 1H
Production
July 2020
2020 1H performance
averaged 28.4 kboepd (net)
completion of FIC infill well)
planned for mid-year
P4
>$2/bbl prm to Brent (Catcher 1H cargos) UK field opex of $13.5/boe (2020 1H)
Catcher plateau rates
kboepd (gross)
Outlook
production by >10 kbopd in Q4
20 40 60
Sanctioned First Oil 2019 2020F
Production
July 2020
P5
NSBA, Indonesia (28.7% op)
maintain profile
hedged at c.$9/mscf Chim Sáo, Vietnam (53.1% op)
>$5/bbl
(Chim Sáo 2020 1H cargoes)
57%
GSA1 market share Q1 2020
Cash generative: c.$50 million of free cash flow generated from NSBA & Chim Sao during 2020 1H NSBA production
kboepd (net) 5 10 15 Q2 19 Q3 19 Q4 19 Q1 20 Q2 20
Development
July 2020
P6
Tolmount indicative production profile1
kboepd (net, Premier 50 per cent)
are partially funding the capex
gas now Q2 2021
Greater Tolmount Area
– Tolmount East, Mongour discoveries – Tolmount Far East, Tolmount South – Initial results from 4D seismic survey very encouraging
1 Company estimates
Tolmount topsides final commissioning Tolmount jacket roll up achieved in Dec 19 5 10 15 20 25 30 2021 2022 2023 2024 2025 2026 2027 2028 2029 2030 Tolmount Tolmount East
<2 years
Tolmount Main payback
Development
resource (P50-P10) including Mongour
concept; FEED underway
power
decision by year-end 2020
plateau production
subsea development
paused with work done to date fully documented
progress regulatory and financial matters
documentation with Navitas being progressed
resource
Zarubezhneft, subject to government approvals
appraisal well campaign planned for 2021
Tuna gas to Vietnam
development plan underway
July 2020
P7
Tolmount East Area Sea Lion Phase 1 Tuna discoveries Block 7 Zama oil field1
resource (P50-P10)
development plan
120 kbopd (gross) to 2040+
regime
process ongoing Premier, 50% op Premier2, 40% op Premier2, 50% op Premier, 25% non-op
1 Extends into neighbouring block which is 100% owned by Pemex 2 Working interest, assuming proposed farm outs
Development
July 2020
Low Carbon by Design
minimising Premier’s emissions
Carbon Neutral by Commitment
geographies
Carbon Neutral (Scopes 1 and 2)
– >65% net zero by 2025 – 100% net zero by 2030
P8
Reducing Scope 1 emissions
Reducing Scope 2 emissions
Advocacy and supported initiatives
GHG intensity
kgCO2e/boe
10 15 20 25 2017 2018 2019
Exploration
July 2020
Area A, Alaska North Slope
encountered gas condensate Block 717, Brazil
mmbbls (gross, P90-P10)
Mexico
Zama; drilling deferred to 2022
reprocessing Andaman Sea, Indonesia
encouraging initial results
now planned for 2022; targeting 1.5 TCF of gross unrisked resource
P9
Timpan DHI
Timpan-1
Multi-TCF
gross potential
Wahoo prospect, Block 30, Mexico Expanded position in South Andaman Sea, Indonesia
>300 mmbbls
On block gross resource potential
Flat Spot Targeting under explored plays in proven hydrocarbon basins
Summary
July 2020
P10
Indicative production profile
kboepd
Base profile Awaiting approval Growth projects
Summary
July 2020
P11
10% 10% 100% 25% 45%
At $65/bbl, 40p/therm the business will deliver
2018-2019 allocation
Discretionary Non-discretionary
10% Reinvestment in new projects will be measured against shareholder returns
Summary
100 200 300 400 500 2020 budget 2020F (July) Abex P&D E&A July 2020
Maintain safe and responsible operations
(before contribution from BP assets)
commence development drilling
Deliver $240m of savings and deferrals
positive cash flows
Preserve optionality of growth projects
Complete proposed transactions
P12
2020F capex reduction
Capital expenditure
$m Final onshore commissioning of Tolmount topsides
Premier Oil Plc 23 Lower Belgrave Street London SW1W 0NR T: +44 (0)20 7730 1111 E: premier@premier-oil.com www.premier-oil.com