
SLIDE 1
BMW Group Investor Presentation, January 2014 Page 1
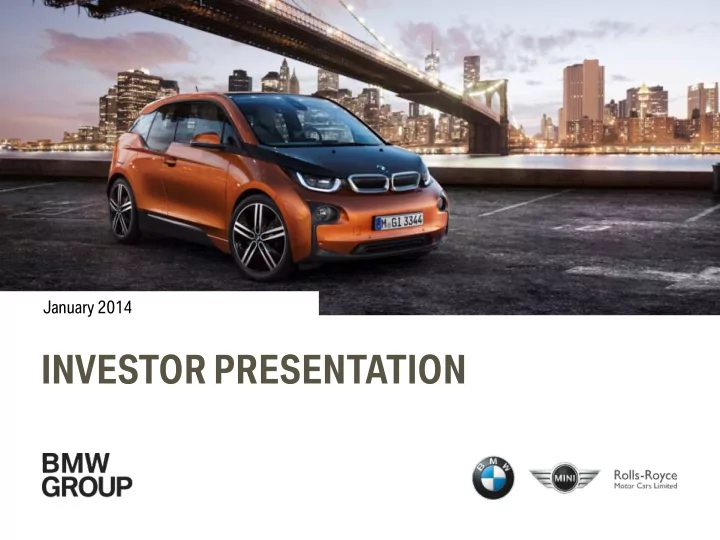
INVESTOR PRESENTATION
January 2014
INVESTOR PRESENTATION BMW Group Investor Presentation, January 2014 - - PowerPoint PPT Presentation
January 2014 INVESTOR PRESENTATION BMW Group Investor Presentation, January 2014 Page 1 THIRD QUARTER / NINE MONTH 2013 RESULTS. in euro million Q3-2013 Q3-2012* Change 9M-2013 9M-2012* Change in % in % Retail sales (units) 481,657
BMW Group Investor Presentation, January 2014 Page 1
January 2014
BMW Group Investor Presentation, January 2014 Page 2
*) Prior year figures have been adjusted in accordance with the revised version of IAS 19, see note 4 on page 37 of the quarterly report to September 30, 2013.
in euro million Q3-2013 Q3-2012* Change in % 9M-2013 9M-2012* Change in % Retail sales (units) 481,657 434,963 10.7 1,436,178 1,335,502 7.5 Group revenues 18,750 18,817
55,848 56,312
Automotive 17,196 17,187 0.1 51,304 50,712 1.2 Financial Services 4,994 4,916 1.6 14,882 14,582 2.1 Penetration Rate (in %)
39.2
1,928 2,002
6,035 6,403
Automotive 1,549 1,647
4,887 5,545
EBIT Margin Automotive (in %) 9.0 9.6
10.9
390 424
1,308 1,291 1.3 Group profit before tax (PBT) 1,989 1,987 0.1 6,024 6,043
Group net profit 1,330 1,289 3.2 4,034 3,918 3.0 Earnings per share (in euro) 2.02 / 2.02 1.95 / 1.95 3.6 / 3.6 6.12 / 6.13 5.94 / 5.95 3.0 / 3.0 Free cash flow (Automotive)1) 784 1,268
2,454 3,224
Research & Development Costs (HGB) 1,270 988 28.5 3,228 2,831 14.0 % of Revenues 6.8 5.3
5.0
1,956 1,232 58.8 4,334 2,721 59.3 % of Revenues 10.4 6.5
4.8
BMW Group Investor Presentation, January 2014 Page 3
Group profit before tax in 2013 should be on a similar scale to that reported for 2012.
Increased sales volumes in 2013 should result in higher revenues and earnings.
Return on Equity of > 18%.
BMW Group Investor Presentation, January 2014 Page 4
BMW Group Investor Presentation, January 2014 Page 5
Page 5
BMW Group Investor Presentation, January 2014 Page 6
Page 6
BMW Group Investor Presentation, January 2014 Page 7
Page 7
BMW Group Investor Presentation, January 2014 Page 8
Efficient combustion engines Innovative technologies
Alternative drive trains Mobility services
BMW Group Investor Presentation, January 2014 Page 9
Internal Combustion Engine E-Mobility Hybrids
In times of technological change we have to improve our existing technologies and invest heavily in new technologies to remain future proof.
time Growth, technological progress
REVOLUTION
Alternative drive trains Mobility services EVOLUTION Efficient combustion engines Innovative technologies
BMW Group Investor Presentation, January 2014 Page 10
BMW Group Investor Presentation, January 2014 Page 11
BMW Group 2012 2016
R&D ratio (cash R&D, %) 5.1 5.0 – 5.5 Capex ratio (%) 6.8 <7.0 Payout ratio (%) 32.0 30.0 – 40.0
Automotive Segment
Retail unit sales (‘000 units) 1,845 > 2,000 Return on Capital Employed (%) 75.0 > 26.0 Return on Sales (EBIT, %) 10.9 8.0 – 10.0 Free cash flow (euro million) 3,809 > 3,000
Segment Financial Services
Return on Equity (%) 21.2 > 18.0
BMW Group Investor Presentation, January 2014 Page 12
R&D Ratio: R&D Expenditure (HGB) / Group Revenues
7.0% 2012 2002 2003 2004 2005 2006 2007 2011 2008 2009 2010 5.1% 5.8% 6.2% 6.7% 6.5% 5.6% 5.4% 6.4% 6.5% 5.0% 4.5% 6.0% 4.0% 4.8% 4.6% 4.9% 5.5%
BMW Group Investor Presentation, January 2014 Page 13
2002
Capex Ratio: Total Capex / Group Revenues
10.0% 8.0% 6.0% 9.0% 5.0% 6.8% 9.5% 10.2% 9.8% 8.6% 8.8% 2012 Target: <7.0% 7.6% 2003 2004 2005 2006 2007 2011 2008 7.9% 2009 6.8% 2010 5.4% 5.4% 7.0%
BMW Group Investor Presentation, January 2014 Page 14
BMW Group Investor Presentation, January 2014 Page 15
Without a Modular Strategy, a three-fold increase in model numbers would send costs and resources spiralling along the process chain. The Modular Strategy enables shorter development cycles and enhanced flexibility in our plants.
BMW Group Investor Presentation, January 2014 Page 16
Modular front seat
Common elements e.g.: Structure Head restraint
Front seat attachment e.g.:
Standardised seat installation process
Underbody e.g.:
Front seat attachments
Lower investment costs Lower fixed costs Lower manufacturing costs Shorter development time Shorter time to market Lower development costs
BMW Group Investor Presentation, January 2014 Page 17
Engine compartment
BMW Group Investor Presentation, January 2014 Page 18
Cylinders (inline)
Gasoline >60 % Diesel >60 % 30-40 %
BMW Group Investor Presentation, January 2014 Page 19
BMW Group Investor Presentation, January 2014 Page 20
Launch 11/2013
Please click on the picture to get to additional videos.
BMW Group Investor Presentation, January 2014 Page 21
BMW Group Investor Presentation, January 2014 Page 22
BMW Group Investor Presentation, January 2014 Page 23
MSRP starts at 34,950 EUR* Weight (DIN) 1,195kg Turning circle 9.86m Output 170hp/250Nm Battery capacity 22kWh 0-60km/h (37mph) in 3.7s 0-100km/h (62mph) in 7.2s Top speed 150km/h (93mph) Charging times from < 30min at 50 kW fast charge to ~8h at domestic socket Range 130-160km (80-100miles), up to 200km (124miles) in most efficient mode
Page 23
* MSRP in Germany including 19% VAT
BMW Group Investor Presentation, January 2014 Page 24 Please click on the picture to get to additional videos.
Launch H1/2014
MSRP starts at 126,000 EUR* Weight (DIN) 1,490kg Output 362hp/320Nm 0-100km/h (62mph) in 4.4s Top speed 250km/h (155mph) Electric driving range 35km (22miles) Fuel consumption 2.5l/100km (94mpg) 59g CO2/km
* MSRP in Germany including 19% VAT
BMW Group Investor Presentation, January 2014 Page 25
BMW Group Investor Presentation, January 2014 Page 26
Generate growth Shaping the future
New target groups. New products and services.
Technologies/ customers
Pioneering technologies and design. Visionary services. New sales concepts. Number ONE Sharpen BMW image as sustainable brand. Differentiation from competition. Future-proof product portfolio.
Growth Shaping the future Profitability Access to new technologies/ customers
BMW Group Investor Presentation, January 2014 Page 27
16 million kilometers ~600 vehicles 16 million kilometers ~1,000 vehicles
BMW i is more than just an electric car. BMW i offers 360° ELECTRIC. BMW i delivers joy of driving. Adequate vehicle. High interest of purchase. Joy of driving and one-pedal-feeling. High satisfaction of mobility needs. Range was rarely the limiting factor. Most users charge 2-3 times per week and charging events decreased during usage.
BMW Group Investor Presentation, January 2014 Page 28
LifeDrive 360° Electric BMW eDrive Mobility services Holistic sustainability Carbon fibres Premium design of the future Connectivity
Page 28
BMW Group Investor Presentation, January 2014 Page 29
“A new mobile lifestyle”
“On the road”
“Convenient charging at home”
“Provide assurance”
360° ELECTRIC.
BMW Group Investor Presentation, January 2014 Page 30
Please click on this production picture for additional video content.
BMW Group Investor Presentation, January 2014 Page 31
Press shop Paint shop Body shop Assembly Conventional vehicle production BMW i production
BMW plant Leipzig BMW plants Dingolfing & Landshut Body shop CFRP parts Externally sourced parts Assembly Painted plastic cladding exterior Drive module
BMW Group Investor Presentation, January 2014 Page 32
Preform CFRP- components BMW i3 & i8
nts
The production of CFRP components is our core competence – preforming, Resin-Transfer-Moulding (RTM), milling and tempering is all done in the BMW Group plant in Landshut. Painting and final assembly is done in the BMW Group plant in Leipzig.
JV MSP*, Otake/Japan Mitsubishi Rayon Co. Ltd. (MRC), Otake/Japan
Acrylonitrile
SGL ACF, Moses Lake/USA
PAN-Precursor
SGL ACF, Wackersdorf/Germany
Carbon Fibers
*) Joint Venture Mitsubishi Rayon –
SGL Precursor Co. Ltd. (MSP)
CF Fabrics Recycling
SGL Automotive Carbon Fibers – a BMW Group and SGL Group JV
BMW Group Investor Presentation, January 2014 Page 33
BMW Group Investor Presentation, January 2014 Page 34
BMW Group Investor Presentation, January 2014 Page 35 303 375 286 273 520 1,312 1,001 1,205 694 601 1,730 2,500 500 1,000 1,500 2,000 2,500 3,000 Brazil Russia India Turkey South Korea Mainland China 2011 2020
27,764
45,701 5,000 10,000 15,000 20,000 25,000 30,000 35,000 40,000 45,000 50,000 Established Markets
CAGR +5.7%
(USA, Japan, Germany, United Kingdom, France, Italy)
2011 2020
thsd. thsd. +14.2% +13.9% +10.4% +9.2% +14.3% +7.4%
Source: Deloitte (June 2011): „The next decade in global wealth among millionaire households”
BMW Group Investor Presentation, January 2014 Page 36
BMW Group Investor Presentation, January 2014 Page 37 50 100 150 200 250 300 350 400 450 2005 2006 2007 2008 2009 2010 2011 2012 2013 BMW MINI
24.0 36.4 51.6 65.8 90.5 169.0 232.6
Source: BMW Group Retail data, FY-2013. in ‘000 units
326.4 390.7
BMW Group Investor Presentation, January 2014 Page 38
Source: BMW & MINI Retail data, FY-2013
BMW Group Investor Presentation, January 2014 Page 39
China urbanization forecast by 2025
Highly-developed areas Less-developed areas
States, McKinsey estimates).
China cities – brief introduction
The scale of China’s cities and the trend towards city urbanization ensure that China will remain a substantial market.
Beijing 16.5 million Tianjin 11.5 million Chengdu 13 million Chongqing 36 million Shanghai 18.5 million Shenzhen 12 million Guangzhou 10 million cities population 1-5 million cities population >10 million cities population 5-10 million
BMW Group Investor Presentation, January 2014 Page 40
500 1,000 1,500 2,000 2,500 3,000 2005 2012 2015E 2020E
Ø annual growth rate
+41% 1,927 2,609
1,224 111
With this development, China will become the biggest market for the BMW Group worldwide.
assumed Ø annual growth rate
assumed Ø annual growth rate
in ‘000 units Source: Global Insight
BMW Group Investor Presentation, January 2014 Page 41
Dali Beijing Yantai Qingdao Taiyuan Hohhot Anshan Shenyang Changchun Daqing Linyi Jinan Weifang Shijiazhuang Baoding Tangshan Shanghai Wuhu Hefei Xuzhou Hangzhou Changzhou Nantong Nanjing Lishui Taizhou Wenzhou Jinhua Ningbo Chengdu Mianyang Chongqing Guiyang Kunming Yichang Wuhan Zhengzhou Xi`an Lanzhou Urumqi Guangzhou Haikou Liuzhou Nanning Chenzhou Changsha Nanchang Xiamen Quanzhou Fuzhou Zhongshan Foshan Shenzhen Shantou Handan Yingkou Panjin Qujing Yancheng Beijing Dalian Deyang Xinxiang Huizhou Erdos Luoyang Yinchuan Linfen Guilin Xining Jjiangmen Baotou Harbin Jinzhou Qinhuangdao Zibo Changzhi Datong Yuncheng Tianjin Bengbu Lianyungang Suzhou Wuxi Yangzhou Huai’an Zhenjiang Huzhou Jiaxing Shaoxing Longyan Dongguan Zhuzhou Zhuhai Zunyi Yulin Leshan Putian Pingdingshan Zhaoqing Mudanjiang Jilin Dongying Ningde Zengcheng Lvliang Shangrao Xiangtan Ganzhou Jiamusi Songyuan Kelamayi Langfang Anyang Lhasa Panzhihua Yanji Wuhai Qiqihar Yibin Tongxiang Fuyang Weinan Hulunbei’er
* 4S: sales, service, spare parts, survey, * 5S: sales, service, spare parts, survey, sustainability
Outlet BMW MINI East 131 30 North 111 22 South 96 20 West 82 20 Total 420 92
Showroom Service outlet 4S/5S* UCC
BMW Group Investor Presentation, January 2014 Page 42
31 35 44 54 94 141 149 20 40 60 80 100 120 140 160 2007 2008 2009 2010 2011 2012 9M-2013
BBA retail sales in 1,000 units BBA‘s contribution to BMW Group‘s at-equity result (in EUR million)
11 25 42 102 175 280 379 50 100 150 200 250 300 350 400 2007 2008 2009 2010 2011 2012 9M-2013 293 406 532 1,046 1,729 2,962 2,575 500 1,000 1,500 2,000 2,500 3,000 3,500 2007 2008 2009 2010 2011 2012 9M-2013
BMW Group revenues from goods and services sold to BBA (in EUR million)
Page 42
BMW Group Investor Presentation, January 2014 Page 43 50 100 150 200 250 300 350 400 450 China* USA Germany UK BRIKT** Japan France Italy Belgium Canada Nordics***
*China: Mainland China only; **BRIKT: Brazil, Russia, India, South Korea and Turkey *** Nordics: Denmark, Estonia, Finland, Latvia, Lithuania, Norway, Sweden Source: BMW & MINI Retail data, FY-2013 in 1,000 units BMW MINI 391 376 259 189 131 64 64 59 43 37 37
BMW Group Investor Presentation, January 2014 Page 44
MINI
5 10 15 20 25 30 35 40 45 50 2006 2007 2008 2009 2010 2011 2012 2013
Retail development in Brazil Retail development in Russia Retail development in India Retail development in South Korea Retail development in Turkey
In 1,000 units BMW
Source: BMW & MINI Retail data, FY-2013
Retail development in BRIKT
20 40 60 80 100 120 140 2006 2007 2008 2009 2010 2011 2012 2013 2 4 6 8 10 12 14 16 18 2006 2007 2008 2009 2010 2011 2012 2013 2 4 6 8 10 12 2006 2007 2008 2009 2010 2011 2012 2013 5 10 15 20 25 30 35 40 45 2006 2007 2008 2009 2010 2011 2012 2013 5 10 15 20 25 2006 2007 2008 2009 2010 2011 2012 2013
25 35 40 45 70 99 131 110 2 3 3 6 10 15 17 10 10 15 19 17 22 30 45 40 1 3 4 6 9 7 10 7 8 10 11 19 27 40 34 6 8 5 7 13 17 22 17
BMW Group Investor Presentation, January 2014 Page 45 29.6 25.0 16.3 11.9 11.8 9.1 7.2 6.8 5.7 3.9 1.0 0.9 5 10 15 20 25 30 35 Germany United Kingdom Italy USA France China Russia Turkey
Japan India Brazil
in % World Average: 9.4%
BMW Group Investor Presentation, January 2014 Page 46 2,000 4,000 6,000 8,000 10,000 12,000 2012 2013 2014 2015 2016 2017 2018 2019 2020
Source: Global Insight
China, CAGR +9.9% Japan, CAGR 0% North America, CAGR +3.9% Western Europe, CAGR +2.2% Rest of World, CAGR +4.7%
Premium Segment: CAGR 2012-2020: 4.7% Total Growth 2012-2020: 45%
*BRIKT refers to Brazil, Russia, India, South Korea and Turkey
Region (‘000 units) 2012 2020 Chg.
World 6,836 9,884 45% Rest of World 500 720 44% BRIKT* 407 687 69% China (Mainland) 1,224 2,609 113% Japan 194 194 0% North America 1,884 2,559 36% Western Europe 2,626 3,116 19%
BRIKT*, CAGR +6.7%
BMW Group Investor Presentation, January 2014 Page 47 200 106 77 73 81 37 53 36 15 301 159 144 126 90 100 76 120 30
50 100 150 200 250 300 350 Russia GCC New EU Countries South America South Korea Brazil Turkey India Ukraine
1) GCC: Gulf Cooperation Council: Bahrain, Kuwait, Oman, Qatar, Saudi Arabia, United Arab Emirates 2) New EU Countries: Bulgaria, Czech Republic, Estonia, Hungary, Latvia, Lithuania, Poland, Rumania, Slovakia, Slovenia 3) South America: Argentina, Bolivia, Chile, Colombia, Costa Rica, Ecuador, El Salvador, Guatemala, Honduras, Mexico, Nicaragua, Panama, Paraguay, Peru, Puerto Rico, Uruguay, Venezuela
2012 Sales Sales Forecast by 2020
3)
Source: Global Insight Russia GCC 1) New EU Countries2) South America3) South Korea Brazil Turkey India Ukraine 50.3% 50.2% 87.6% 72.1% 10.4% 169.1% 43.8% 235.5% 93.3% in ‘000 units
BMW Group Investor Presentation, January 2014 Page 48
BMW Group Investor Presentation, January 2014 Page 49
BMW Group Investor Presentation, January 2014 Page 50
Deliveries of automobiles (in units) 2013 2012 Change in %
Mainland China 390,713 326,444 19.7 USA 375,782 347,583 8.1 Germany 259,135 287,299
United Kingdom 188,837 174,215 8.4 BRIKT* 131,447 110,363 19.1 Japan 64,216 56,607 13.4 France 64,082 67,318
Italy 59,200 60,505
Belgium 43,255 43,828
Canada 37,723 37,707 0.0 Nordics** 37,072 34,510 7.4 Rest of world 312,336 298,807 4.5
BMW Group 1,963,798 1,845,186 6.4
*BRIKT: Brazil, Russia , India, South Korea and Turkey; ** Nordics: Denmark, Estonia, Finland, Latvia, Lithuania, Norway, Sweden Data for individual markets includes BMW and MINI vehicles; Rolls Royce sales are included in “Rest of World” and in the total figures.
BMW Group Investor Presentation, January 2014 Page 51
Deliveries of automobiles (in units) 2013 2012 Change in % Total BMW 1,655,138 1,540,085 7.5
1 series 213,578 226,829
3 series (incl. GT) 500,695 406,752 23.1 4 series 14,749
366,992 359,016 2.2 6 series 27,687 23,193 19.4 7 series 56,001 59,184
X1 161,353 147,776 9.2 X3 157,298 149,853 5.0 X5 107,231 108,544
X6 36,688 43,689
Z4 12,866 15,249
Total MINI 305,030 301,526 1.2 Total Rolls-Royce 3,630 3,575 1.5
BMW Group 1,963,798 1,845,186 6.4
BMW Group Investor Presentation, January 2014 Page 52
+19.7 %
+9.1%
24% 44% 20%
13%
Source: BMW and MINI Retail Sales only, FY-2013 (figures do not add to 100% due to rounding)
BMW Group Investor Presentation, January 2014 Page 53
Japan: 3.0% GCC2): 1.1% Rest of the World: 4.4% Germany: 13.2% USA: 19.2% Rest of Europe: 12.2% Mainland China: 19.9% UK: 9.6% Italy: 3.3% Canada: 1.9% Belgium: 2.2% France: 3.3%
1) BRIKT: Brazil, Russia, India, South Korea, Turkey 2) GCC: Gulf Cooperation Council: Bahrain, Kuwait, Oman, Qatar, Saudi Arabia, United Arab Emirates
Source: BMW and MINI Retail Sales only, FY-2013
BRIKT1): 6.7%
BMW Group Investor Presentation, January 2014 Page 54 1 Series 3 Series (incl. GT) 4 Series 5 Series (incl. GT) 6 Series 7 Series X1 X3 X5 X6 Z4
100% 12.9% 30.3% 0.9% 22.2% 1.7% 9.7% 9.5% 0.8%
Total BMW Group sales: 1,963,798 (1,845,186 ) units.
BMW brand share: 1,655,138 (1,540,085) units
(100%) (14.7%) (26.4%) (-) (21.9%) (1.5%) (9.6%) (9.7%) (1.0%)
1,655,138 (1,540,085) 366,992 (337,929) 27,687 (23,193) 161,353 (147,776) 12,866 (15,249) 157,298 (149,853) 107,231 (108,544) 56,001 (59,184) 36,688 (43,689 )
3.4% (3.8%) 6.5% (7.0%) 2.2% (2.8%)
500,695 (406,752) 14,749 (-) 213,578 (226,829)
BMW Group Investor Presentation, January 2014 Page 55 Hatch Convertible Clubman Countryman Coupe Roadster Paceman
100% 42.1% 6.9% 6.9% 33.4% (100%) (43.6%) (7.5%) (33.9%) (3.8%) 234,175 (216,538) 128,498 (131,569) 21,030 (22,699) 101,897 (102,271) 8,436 (11,311) 9,315 (9,202)
Total BMW Group sales: 1,963,798 (1,845,186) units.
MINI brand share: 305,030 (301,526) units
14,687 (-) (-) 305,030 (301,526) 21,167 (24,474) 3.1% 4.8% 2.8% (3.1%) (8.1%)
BMW Group Investor Presentation, January 2014 Page 56
in 1,000 units 200 400 600 800 1,000 1,200 1,400 1,600 1,800 2,000 2003 2004 2005 2006 2007 2008 2009 2010 2011 2012 2013 BMW MINI Rolls-Royce
1,105 1,209 1,328 1,374 1,501 1,436 1,286 1,461 +9.4% +3.5% +9.2%
+13.6% 1,845 +14.2% +9.9% +10.6% 1,669 1,964 +6.4%
BMW Group Investor Presentation, January 2014 Page 57 MINI
4 Series
Sedan Wagon Hatch Coupe Convert. Roadster New Seg. SAV Plus Base Plus PlusPlus Base
7 Series 6 Series 6 Series
Plus Base
Luxury Compact Lower Medium Small
Plus Base
Upper Medium
Base Plus PlusPlus
Convert. Phantom Coupe 3 Series 3 Series Z4 X3, X4 4 Series MINI MINI MINI 1 Series 2 Series 2 Series X5, X6 5 Series 5 Series GT X1 Ghost MINI 6 Series GT Wraith
BMW Group Investor Presentation, January 2014 Page 58
2011 2012 2013 2014 2015 2016
Ø age of product portfolio (sales & mix adjusted) 3.5 2.0 1.5 0.5 2.5 1.0 3.0
BMW Group Investor Presentation, January 2014 Page 59
Launch 06/2013
BMW Group Investor Presentation, January 2014 Page 60
Launch 10/2013
Page 60 Please click on the picture to get to additional videos.
BMW Group Investor Presentation, January 2014 Page 61
Launch 11/2013
Please click on the picture to get to additional videos.
BMW Group Investor Presentation, January 2014 Page 62
Launch 03/2014
Page 62 Please click on the picture to get to additional videos.
BMW Group Investor Presentation, January 2014 Page 63
Launch 03/2014
Page 63 Please click on the picture to get to additional videos.
BMW Group Investor Presentation, January 2014 Page 64
BMW Group Investor Presentation, January 2014 Page 65
BMW Group Investor Presentation, January 2014 Page 66
Launch 03/2014
Please click on the picture to get to additional videos.
BMW Group Investor Presentation, January 2014 Page 67 Please click on the picture to get to additional videos.
Launch 09/2013
BMW Group Investor Presentation, January 2014 Page 68
BMW ActiveHybrid 3
(Launch 09/2012)
BMW ActiveHybrid 7
(Facelift, new hybrid system, launch 07/2012)
BMW ActiveHybrid 5
(Launch 03/2012)
BMW Group Investor Presentation, January 2014 Page 69
BMW TwinPower Turbo six-cylinder inline engine. Synchronous electric motor (integrated in the transmission housing). Eight-speed automatic transmission. Power electronics. High-performance lithium-ion battery.
BMW Group Investor Presentation, January 2014 Page 70
BMW Group Investor Presentation, January 2014 Page 71
Price (€)
R1200 RT
20,000 10,000
R1200 GS Adventure F800 GT F 700 GS 2 Cyl. S1000 RR F800 R R1200 R K1300 S K1600 GT/GTL Maxi Scooter Tourer G650 GS / GS Sertao Maxi Scooter Electric Maxi Scooter Sport K 1300 R
URBAN MOBILTIY
R1200 GS MJ 2013 F800 GS 2 Cyl. HP4
BMW Group Investor Presentation, January 2014 Page 72 31.3 50.2 74.6 84.7 92.6 93.0 92.3 97.5 100.1 102.5 101.7 87.3 98.0 104.3 106.4 115.2 20 40 60 80 100 120 1990 1995 2000 2001 2002 2003 2004 2005 2006 2007 2008 2009 2010 2011 2012 2013
in 1,000 units
BMW Group Investor Presentation, January 2014 Page 73
Germany United States Italy Brazil United Kingdom Other markets France Germany 19.1% United States 12.3% France 9.8% Italy 9.7% Brazil 6.4% United Kingdom 5.0% Spain 4.5% Other markets 33.2% Spain
BMW Group Investor Presentation, January 2014 Page 74
BMW Group Investor Presentation, January 2014 Page 75
BMW Financial Services MINI Financial Services
Status: September 30, 2013
BMW Group Investor Presentation, January 2014 Page 76 345 387 422 452 515 605 685 743
365 1,214 1,790 1,561 1,314
250 500 750 1,000 1,250 1,500 1,750 2,000 2000 2001 2002 2003 2004 2005 2006 2007 2008 2009 2010 2011 2012 9M-2013
in euro million
ADDITIONAL RISK PROVISIONS IN 2008.
Automotive Segment: EUR 911 million residual values Financial Services segment: EUR 1,057 million EUR 694 million residual values EUR 363 million credit losses
Total: EUR 1,968 million
1) 2) 3)
1) FY-10 EBT includes a positive effect of EUR 122 million from better than expected off-lease business. 2) FY-11 EBT includes a positive effect of EUR 439 million from adjustment of residual value and credit risk provisions and a better than expected off-lease business. 3) FY-12 EBT includes a positive effect of EUR 124 million from better than expected off-lease business.
BMW Group Investor Presentation, January 2014 Page 77 18.1%
9.2% 26.1% 29.4% 21.2%
0% 5% 10% 15% 20% 25% 30% 35% 2007 2008 2009 2010 2011 2012
in %
1) 2)
1) FY-10 RoE includes a positive PBT effect of EUR 122 million from better than expected off-lease business (adjusted RoE: 23.5%). 2) FY-11 RoE includes a positive PBT effect of EUR 439 million from adjustment of residual value and credit risk provisions and a better than expected off-lease
business (adjusted RoE: 22.2%)
3) FY-12 EBT includes a positive effect of EUR 124 million from better than expected off-lease business (adjusted RoE: 19.6%).
ADDITIONAL RISK PROVISIONS IN 2008.
Automotive Segment: EUR 911 million residual values Financial Services segment: EUR 1,057 million EUR 694 million residual values EUR 363 million credit losses
Total: EUR 1,968 million
3)
BMW Group Investor Presentation, January 2014 Page 78
13.6% 17.8% 17.8% 19.2% 19.5% 17.1% 17.2% 17.4% 20.9% 24.7% 24.1% 20.0% 20.7% 23.2% 20.9% 17.2% 18.3% 19.1% 22.5% 24.0% 25.2% 27.2% 27.6% 24.3% 24.1% 21.1% 19.7% 21.8% 0% 5% 10% 15% 20% 25% 30% 35% 40% 45% 50% 55%
2000 2001 2002 2003 2004 2005 2006 2007 2008 2009 2010 2011 2012 9M-2013
Financing Leasing
34.5% 35.0% 36.1% 38.3% 42.0% 41.1% 42.4% 48.5% 44.6% 49.0% 41.1% 48.2%
* The penetration rate dropped significantly due to the consolidation of BMW Group Financial Services China as of January 1st, 2011. *
40.4% 45.0%
BMW Group Investor Presentation, January 2014 Page 79
0.54% 0.46% 0.41% 0.37% 0.41% 0.46% 0.59% 0.84% 0.67% 0.49% 0.48% 0.39% 0.3% 0.4% 0.5% 0.6% 0.7% 0.8% 0.9% 2002 2003 2004 2005 2006 2007 2008 2009 2010 2011 2012 9M-2013
BMW Group Investor Presentation, January 2014 Page 80 70 75 80 85 90 95 100 105 110 115 120 Jan 06 Apr 06 Jul 06 Oct 06 Jan 07 Apr 07 Jul 07 Oct 07 Jan 08 Apr 08 Jul 08 Oct 08 Jan 09 Apr 09 Jul 09 Oct 09 Jan 10 Apr 10 Jul 10 Oct 10 Jan 11 Apr 11 Jul 11 Oct 11 Jan 12 Apr 12 Jul 12 Oct 12 Jan 13 Apr 13 Jul 13 Oct 13
Source: Manheim Used Vehicle Index, mix and mileage adjusted.
BMW brand used car index (through December 2013)
BMW Group Investor Presentation, January 2014 Page 81
Expansion of BMW Bank E-Mobility New Sales & Service Channels Fleet Business
* BMW Leasing GmbH was merged into the BMW Bank GmbH
2011 since 2010 since 2009 2012 BaLea*
FR DE IT ES PT DE
BMW Group Investor Presentation, January 2014 Page 82
New Alphabet : A truly European company
ING Car Lease Alphabet both
Number of Serviced Contracts
100,000 200,000 300,000 400,000 500,000 600,000 (old) Alphabet Former ING Car Lease Alphabet
BMW Group Investor Presentation, January 2014 Page 83
BMW Group Investor Presentation, January 2014 Page 84
Moses Lake Spartanburg Shenyang Rayong Chennai Kulim Jakarta Rosslyn Santa Catarina (2014) Manaus Vehicle Plant Assembly Plant Engines / Components BMW Group Joint Venture Contract Production Cairo
Page 84
Regensburg Dingolfing Berlin Eisenach Leipzig Wackersdorf Landshut Munich Kaliningrad Born (2014) Steyr Graz Hams Hall Oxford Swindon Goodwood
BMW Group Investor Presentation, January 2014 Page 85
in 1,000 units
Dingolfing Regensburg Oxford Leipzig Munich Spartanburg Rosslyn Dadong1 Tiexi1 Graz2 Goodwood
Dingolfing, Germany Production of BMW 5, 6, 7 Series 332.7 Rosslyn, South Africa Production of BMW 3 Series 45.7 Spartanburg, USA Production of BMW X3, X5, X6 301.5 Goodwood, UK Production of Rolls-Royce 3.3 Regensburg, Germany Production of BMW 1, 3 Series, Z4 300.3 Dadong1, China Production of BMW 5 Series 108.9 Munich, Germany Production of BMW 3 Series 214.1 Tiexi1, China Production of BMW 3 Series, X1 41.1 Oxford, UK Production of MINI 207.8 Graz (Magna Steyr2), Austria MINI Countryman 103.7 Leipzig, Germany Production of BMW 1 Series, X1 164.3 Assembly plants 38.4
1 Joint venture 2 Contract production
Assembly plants
BMW Group Investor Presentation, January 2014 Page 86
Cairo, Egypt 3, 5 & 7 series, X1, X3 2,232 Kaliningrad, Russia 3,5 & 7 series, X1, X3, X5, X6 15,480 Jakarta, Indonesia 3 & 5 series, X1, X3 1,992 Kulim, Malaysia 3 & 5 series, X1, X3 5,448 Chennai, India 3, 5 & 7 series, X1, X3 6,768 Rayong, Thailand 3, 5 & 7 series, X1, X3 6,492
Kaliningrad Kulim Chennai Rayong Cairo Jakarta
In units
BMW Group Investor Presentation, January 2014 Page 87
Certified environmental management systems (ISO 14001/EMAS) at all sites worldwide Targeted management of environmental performance:
Reducing water usage and process wastewater Saving energy and reducing CO2 emissions Reducing Solvent Emissions Avoiding or recycling waste
BMW Group Investor Presentation, January 2014 Page 88
BMW Group Investor Presentation, January 2014 Page 89
„Sustainability throughout the value added chain is inseparable from our corporate self-image. That is why we choose to take responsibility. Because of our convictions, but also our self-interest, now and in the future.“
1997 2001 2007 2011 2008
1973: First Environmental Officer in the Automotive Industry. 2000: Executive Board Resolution „Sustainability is the guiding principle of the BMW Group corporate strategy“. 2009: Establishment of a Sustainability Circle and Board; corporate sustainability is established as corporate target.
BMW Group Investor Presentation, January 2014 Page 90
Key Issues Basic principles BMW Group Objective
The BMW Group is the most sustainable company in the automotive industry. Vision
Ecology Society Economy
Sustainable Mobility Concepts Product Responsibility Efficient Dynamics Environmental Protection Clean Production Responsibility for Employees Value Orientation in the Supply Chain Commitment to Society Shareholder Value Risk Management Corporate Governance & Compliance
Sustainability management
Sustainability-based Decisions Environment Radar Communication Evaluation of the Value Chain
BMW Group Investor Presentation, January 2014 Page 91
BMW Group Investor Presentation, January 2014 Page 92
automotive company continuously listed since 1999.
automotive industry.
BMW Group Investor Presentation, January 2014 Page 93
BMW Group Investor Presentation, January 2014 Page 94
Page 94
BMW Group Investor Presentation, January 2014 Page 95
Improved combustion engines Aerodynamics Lightweight construction Auto Start-Stop function Brake energy regeneration
Plug-in hybrid Hybrid Electro-mobility
Fuel cell technology
BMW Group Investor Presentation, January 2014 Page 96
High Precision Injection. Common Rail High Pressure Injection. Active aerodynamics with cooling air flap system. Tires with reduced rolling resistance. Break energy regeneration. Electric water pump. Decoupled A/C compressor. Controlled fuel pump. Controlled
Electric steering. Gear shift indicator. Auto Start Stop function. ECO Mode.
Aerowheels. Air Curtain.
BMW Group Investor Presentation, January 2014 Page 97
around the front wheels
Flow-optimised underbody structure Cd = 0.26
BMW Group Investor Presentation, January 2014 Page 98
BMW Group Investor Presentation, January 2014 Page 99
VARIABILITY DIRECT INJECTION TURBOCHARGING VARIABILITY DIRECT INJECTION TURBOCHARGING
VALVETRONIC HIGH PRECISION INJECTION SINGLE TURBO TWIN-SCROLL TURBO TWIN TURBO VARIABLE TURBOCHARGER GEOMETRY SINGLE TURBO TWIN TURBO TRI TURBO 3RD GENERATION COMMON RAIL TECHNOLOGY
GASOLINE DIESEL
BMW Group Investor Presentation, January 2014 Page 100
In autumn 2013 already 39 BMW Group models come with a maximum 120 g CO2/km.
Fuel consumption figures: liters/100 km in EU test cycle, CO2 figures: g/km. * EfficientDynamics Edition.
BMW 114d 5-Door 70 kW / 95 hp 4.1 l / 109 g BMW 118d 5-Door 105 kW / 143 hp 4.1 l / 109 g BMW 120d 5-Door 135 kW / 184 hp 4.2 l / 110 g BMW 114d 3-Door 70 kW / 95 hp 4.1 l / 109 g BMW 116d 3-Door 85 kW / 116 hp 4.1 l / 109 g BMW 116d 5-Door 85 kW / 116 hp 4.1 l / 109 g BMW 116d 5-Door * 85 kW / 116 hp 3.8 l / 99 g BMW 116d 3-Door * 85 kW / 116 hp 3.8 l / 99 g BMW 118d Coupé 105 kW / 143 hp 4.5 l / 118 g BMW 316d 85 kW / 116 hp 4.3 l / 114 g BMW 318d 105 kW / 143 hp 4.3 l / 114 g BMW 320d 135 kW / 184 hp 4.4 l / 117 g BMW 118d 3-Door 105 kW / 143 hp 4.1 l / 109 g BMW 120d 3-Door 135 kW / 184 hp 4.2 l / 110 g BMW 320d * 120 kW / 163 hp 4.1 l / 109 g BMW 316d Touring 85 kW / 116 hp 4.5 l / 119 g BMW 318d Touring 105 kW / 143 hp 4.5 l / 119 g MINI One MINIMALIST 55 kW / 75 hp. 72 kW / 98 hp 5.1 l / 119 g MINI Cooper SD 105 kW / 143 hp 4.3 l / 114 g MINI Cooper D Convertible 82 kW / 112 hp 4.0 l / 105 g MINI Cooper SD Convertible 105 kW / 143 hp 4.5 l / 118 g MINI One D Clubman 66 kW / 90 hp 3.9 l / 103 g MINI One D 66 kW / 90 hp 3.8 l / 99 g MINI Cooper D 82 kW / 112 hp 3.8 l / 99 g MINI Cooper D Clubman 82 kW / 112 hp 3.9 l / 103 g MINI Cooper D Countryman 82 kW / 112 hp 4.4 l / 115 g MINI Cooper SD Roadster 105 kW / 143 hp 4.5 l / 118 g MINI Cooper SD Coupé 105 kW / 143 hp 4.3 l / 114 g MINI Cooper D Paceman 82 kW / 112 hp 4.4 l / 115 g MINI Cooper SD Clubman 105 kW / 143 hp 4.4 l / 115 g MINI One D Countryman 66 kW / 90 hp 4.4 l / 115 g BMW 320d Touring* 120 kW / 163 hp 4.3 l / 112 g BMW X1 sDrive20d * 120 kW / 163 hp 4.5 l / 119 g BMW 520d 135 kW / 184 hp 4.5 l / 119 g BMW 318d GT 105 kW / 143 hp 4.5 l / 119 g BMW 518d 105 kW / 143 hp 4.5 l / 119 g BMW i3 125 kW / 170 hp 0 l / 0g BMW i3 Rex 125 kW / 170 hp 0,6 l / 13g
BMW Group Investor Presentation, January 2014 Page 101
BMW GROUP FLEET 1995 > 200 CO2 g/km BMW GROUP FLEET 2012 138 CO2 g/km 2020 TARGET FOR TOTAL EU FLEET 95 CO2 g/km*
*Value for the BMW Group fleet 100-110 CO2 g/km
BMW Group Investor Presentation, January 2014 Page 102
New Engine Family Vehicles Technologies
BMW Group Investor Presentation, January 2014 Page 103
Cylinders (inline)
Gasoline >60 % Diesel >60 % 30-40 %
BMW Group Investor Presentation, January 2014 Page 104
Combustion Chamber:
Different aspects for Gasoline/Diesel:
Approximate range of torque and power per cylinder:
75-100 Nm, 20-40 kW
BMW Group Investor Presentation, January 2014 Page 105
ACC Navigation Camera DSC PDC DME Light/Rain Sensor
Brake Energy Regeneration Heat- management Green Routing / Driver assistence Aerodynamics Air conditioning Auto Start Stop Function
BMW Group Investor Presentation, January 2014 Page 106
BMW Group Investor Presentation, January 2014 Page 107
Automotive: Return on Capital Employed Vehicle projects: Model return based on DCF Finance & lease portfolio: Cash flows Motorcycles: Return on Capital Employed Financial Services: Return on Equity Vehicle projects: Model return based on DCF
BMW Group Investor Presentation, January 2014 Page 108
EBIT 2011 EBIT margin 11.8% EBIT 2012 10.9% +1,026
Net effects FX/ Raw material
+106
Other
income & expenses
+437
Volume/ Mix/Market
+131
Depreciation
HR
in euro million
Residual values
7,477 7,624
Net effects Number ONE
BMW Group Investor Presentation, January 2014 Page 109
9.0 8.8 8.1 7.9 7.8 6.7 6.4 6.4 1.4
8.0 11.8 10.9 9.9 9.6 9.0
1 2 3 4 5 6 7 8 9 10 11 12 13 2000 2001 2002 2003 2004 2005 2006 2007 2008 2009 2010 2011 2012 Q1- 2013 Q2- 2013 Q3- 2013
in %
BMW Group Investor Presentation, January 2014 Page 110
350 351 392 419 419 458 694 197 197 852 1,508 1,640 18.8% 17.4% 20.1% 18.7% 18.7% 15.9% 22.1% 59.7% 93.8% 26.3% 30.7% 32.0% 0.0% 10.0% 20.0% 30.0% 40.0% 50.0% 60.0% 70.0% 80.0% 90.0% 100.0% 500 1,000 1,500 2,000 2001 2002 2003 2004 2005 2006 2007 2008 2009 2010 2011 2012 Dividend per share (in €) 2001 2002 2003 2004 2005 2006 2007 2008 2009 2010 2011 2012 Ordinary share 0.52 0.52 0.58 0.62 0.64 0.70 1.06 0.30 0.30 1.30 2.30 2.50 Preferred share 0.54 0.54 0.60 0.64 0.66 0.72 1.08 0.32 0.32 1.32 2.32 2.52 Total payout (in € million, LHS) Payout ratio* (RHS) *Payout ratio based on Group net income before minority interest.
BMW Group Investor Presentation, January 2014 Page 111 1 2 3 4 5 6 1 2 3 4 5 6
+ 7,484 + 2,205 + 4,784
13,327 +1,078
31.12.2012 30.09.2013
Euro million Euro million
Cash and cash equivalents Marketable securities Financial liabilities Net interest- bearing assets Internal net financial receivables from Financial Services Segment Internal net financial receivables from Other Entities Segment
+ 6,741 + 2,714 + 3,889
12,446 +1,407
Cash and cash equivalents Marketable securities Financial liabilities Net interest- bearing assets Internal net financial receivables from Financial Services Segment Internal net financial receivables from Other Entities Segment
BMW Group Investor Presentation, January 2014 Page 112 6,246 4,471 4,921 8,150 8,110 9,167 2,147
2,608 3,166 3,809 197 1,456 4,471 2,385 3,637
2,000 4,000 6,000 8,000 10,000 2007 2008 2009 2010 2011* 2012 Cash inflow from operating activities Free Cash Flow including net investments in securities Free Cash Flow before net investments in securities
in euro million
* 2011 restated: the reclassification from operating activities to financing activities resulted in an increase in the operating cash flow.
BMW Group Investor Presentation, January 2014 Page 113 2,597 2,777 2,934 2,980 2,384 2,312 2,720 4,151 1,396 1,536 1,333 1,224 1,087 951 972 1,089 8.6% 8.8% 7.6% 7.9% 6.8% 5.4% 5.4% 6.8% 5.2% 5.4% 4.8% 5.4% 4.6% 3.7% 3.8% 5.2% 0% 2% 4% 6% 8% 10% 12% 1,000 2,000 3,000 4,000 5,000 6,000 2005 2006 2007 2008 2009 2010 2011 2012 Capital expenditure in property, plant, equipment and intangible assets Capitalized development costs Capital expenditure ratio* Capex into PPE ratio*
in euro million
3,993 4,267 4,313 4,204 3,471 3,263 3,692 5,240
* based on Group revenues
BMW Group Investor Presentation, January 2014 Page 114
5.3% 5.2% 5.2% 5.3% 5.1% 5.1% 5.2% 5.2% 6.7% 6.5% 5.6% 5.4% 4.8% 4.6% 4.9% 5.1% 44.8% 47.9% 42.4% 42.8% 44.4% 34.3% 28.8% 27.6% 0% 10% 20% 30% 40% 50% 1% 2% 3% 4% 5% 6% 7% 8% 2005 2006 2007 2008 2009 2010 2011 2012 R&D Costs (IFRS) / Group revenues in % R&D Costs (HGB ) / Group revenues in % Capitalisation Ratio
in euro million
2005 2006 2007 2008 2009 2010 2011 2012 Research & Development Costs (IFRS) 2,464 2,544 2,920 2,825 2,587 3,082 3,610 3,993 Research & Development Costs (HGB) 3,115 3,208 3,144 2,864 2,448 2,773 3,373 3,952
BMW Group Investor Presentation, January 2014 Page 115
BMW Group Investor Presentation, January 2014 Page 116
Ensure sustainable access to international financial markets. Explore and maintain presence and competence in all strategic important capital markets worldwide.
The different objectives are interdependent and of equal importance.
Value Orientation Financial Flexibility Financial Independence
Ensure independence from individual lenders, banks and financial Instruments. Diversification of funding sources, investors and products. Create value by optimizing financing costs on overall Group basis. Credit spread management for each financial instrument. Ensure long-term, strategic perspective (instrument mix).
BMW Group Investor Presentation, January 2014 Page 117
Categories of available instruments over the spectrum of maturities: CP ABCP <1yr 1yr 2yrs 3yrs 4yrs 5yrs 7yrs 10yrs+ (EMTN) PPs ABS - Term Bonds Retail Institutional
Bank Loans
CP Attractive and flexible short- term funding. Deposits Diversification of funding instruments and investors (EMTN) Private Placements Attractive funding source. Effective management of spreads provides support for the short end of the BMW Credit Curve. ABS ABS supports investor diversification. Bank Loans Local source of funding, mainly where access to capital markets is limited. Retail Diversification of investor base. Limited potential of
Institutional Highest liquidity and depth of the market, i.e. highest funding potential. Typical for Benchmark bonds. Creation of a BMW Credit Spread Curve.
Customer Deposits / Brokered CDs
BMW Group Investor Presentation, January 2014 Page 118
EUR 35bn EMTN-Program
EUR 5bn ECP-Program EUR 2bn FCP-Program USD 7bn USCP-Program BMW AG BMW Australia Finance Limited BMW Finance N.V. BMW Japan Finance Corp. BMW US Capital, LLC BMW AG BMW Finance N.V. BMW Coordination Center V.O.F. BMW Malta Finance Ltd BMW Finance N.V. BMW US Capital, LLC EMTN Program as main mid- to long-term refinancing program with commercial paper programs to cover short-term liquidity needs. All issuing programs carry an unconditional guarantee from BMW AG.
BMW Group Investor Presentation, January 2014 Page 119
Funding is done worldwide to optimize refinancing costs and to establish a broad investor base.
USA USD Commercial Paper USD US PP USD ABS Euro Capital Markets EUR Commercial Paper French Commercial Paper EUR (EMTN) PPs EUR Benchmark Bonds USD Eurodollar AUD Euroaussie NOK (EMTN) Bonds SEK (EMTN) Bonds EUR ABS Great Britain GBP Commercial Paper GBP (EMTN) PPs GBP Bonds GBP ABS Switzerland CHF (EMTN) PPs CHF Bonds CHF ABS Japan JPY (EMTN) PPs JPY Euro-Yen JPY ABS Offshore US USD (EMTN) PPs Australia AUD (EMTN) PP AUD ABS Hong Kong RMB (EMTN) PP HKD (EMTN) PP South Africa ZAR ABS ZAR Domestic Bonds Canada CAD ABS CAD (EMTN) PPs CAD Domestic Bonds Mexico MXN (EMTN) PP India INR Domestic Bond South Korea KRW Domestic Bond KRW ABS
BMW Group Investor Presentation, January 2014 Page 120 3.5 2.7 3.7 7.5 9.3 10.8 8.4 7.8 8.0 8.0 7.1 7.4 7.1 7.5 8.5 7.8 9.3 8.1 8.5 8.4 7.9 8.1 7.7 1.9 2.1 1.2 0.7 0.8 1.1 1.5 1.6 1.7 1.7 1.6 1.6 1.5 1.7 2.4 2.3 2.7 2.7 2.6 2.7 3.0 2.9 3.0 2 4 6 8 10 12 14
Q1-08 Q2-08 Q3-08 FY-08 Q1-09 Q2-09 Q3-09 FY-09 Q1-10 Q2-10 Q3-10 FY-10 Q1-11 Q2-11 Q3-11 FY-11 Q1-12 Q2-12 Q3-12 FY-12 Q1-13 Q2-13 Q3-13
Cash & cash equivalents Marketable securities & investment funds
After significantly increasing liquidity during the economic and financial crisis, the BMW Group continues to maintain a solid liquidity position.
in euro billion
5.4 4.8 4.9 8.2 10.1 11.9 9.9 9.4 9.7 9.7 8.7 9.0 9.1 8.6 10.9 10.1 12.0 10.8 11.0 11.0 11.0 11.0 10.7
BMW Group Investor Presentation, January 2014 Page 121 100 200 300 400 500 Jan 07 Jul 07 Jan 08 Jul 08 Jan 09 Jul 09 Jan 10 Jul 10 Jan 11 Jul 11 Jan 12 Jul 12 Jan 13 Jul 13 Jan 14
Source: Reuters Credit Views as of 01/10/2014
bps
BMW Group Investor Presentation, January 2014 Page 122
in euro million
Maturities based on nominal values excluding derivatives.
1,000 2,000 3,000 4,000 5,000 6,000 7,000 8,000 9,000 10,000 2012 2013 2014 2015 2016 2017 2018 2019 2020 2021 2022 2023 2024 Issuance Maturities
BMW Group Investor Presentation, January 2014 Page 123
BMW Group maintained a well-diversified debt structure. The average maturity of financial liabilities is approximately 2.0 years.
*Adjusted, excluding currency and interest rate derivatives.
Bank loans Commercial Paper ABS Others 1% Customer deposits Bonds / PPs/ SSDs EUR 68.0 bn* 15% 7% 12% 7% ≤1 year
57 %
(56%**)
43 %
(44%**)
Debt Maturity > 1 year 48%
** comparative figures as of 31 December 2012
Brokered CDs 6% 4% Structured finance
BMW Group Investor Presentation, January 2014 Page 124
ABS
Bonds
Private Placements
Commercial Paper
Schuldschein
BMW Group Investor Presentation, January 2014 Page 125
Torsten Schüssler Head of Investor Relations
+49-89-382-25387 torsten.schuessler@bmw.de
Andreas Stöffler Equity IR
+49-89-382-17944 andreas.stoeffler@bmw.de
Carina Wollmann Equity & SRI IR
+49-89-382-21378 carina.wollmann@bmw.de
Bernd Daser Debt & Equity IR
+49-89-382-31684 bernd.daser@bmw.de
Helge Jorch Equity & SRI IR
+49-89-382-24272 helge.jorch@bmw.de
Ziye Zhou Debt & Equity IR
+49-89-382-16190 ziye.zhou@bmw.de