
SLIDE 1
19/06/2018 1
Investor presentation
19 June 2018
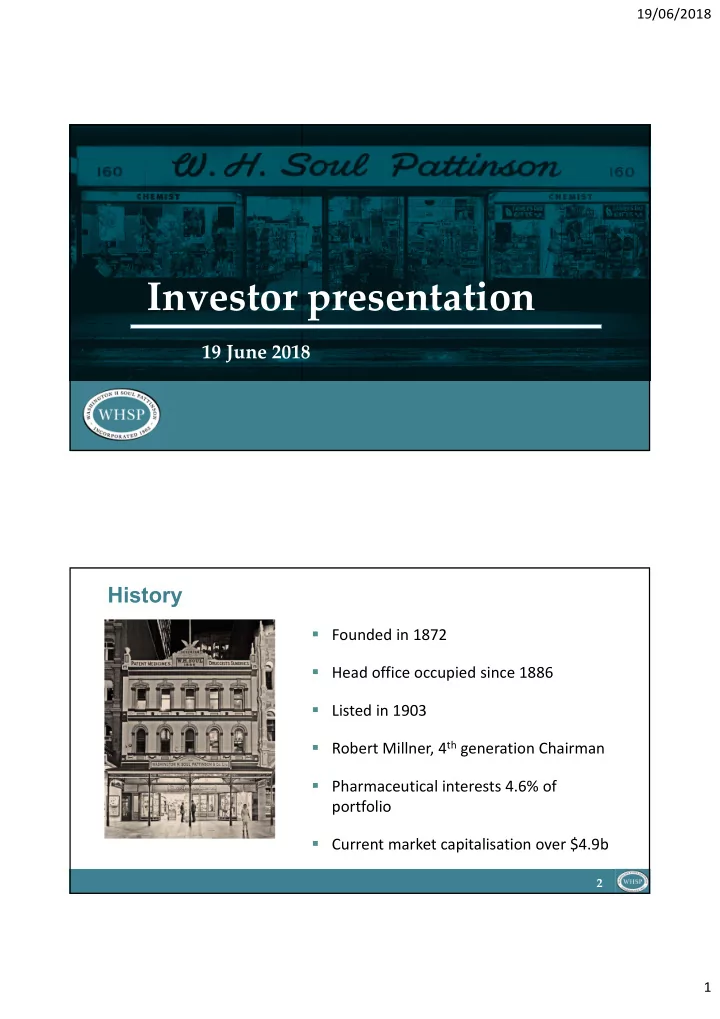
History
2
- Founded in 1872
- Head office occupied since 1886
- Listed in 1903
- Robert Millner, 4th generation Chairman
- Pharmaceutical interests 4.6% of
portfolio
- Current market capitalisation over $4.9b