INVESTOR PRESENTATION June 2006 2 Introducing Implats Cont - - PDF document

investor presentation
SMART_READER_LITE
LIVE PREVIEW

INVESTOR PRESENTATION June 2006 2 Introducing Implats Cont - - PDF document

INVESTOR PRESENTATION June 2006 2 Introducing Implats Cont ontrib ribution b on by m metal Implats is in the business of Other, 5.5% Palladium, mining, refining and 8.5% marketing platinum group Nickel, 10.5% metals and associated


slide-1
SLIDE 1

INVESTOR PRESENTATION

June 2006

2

Introducing Implats

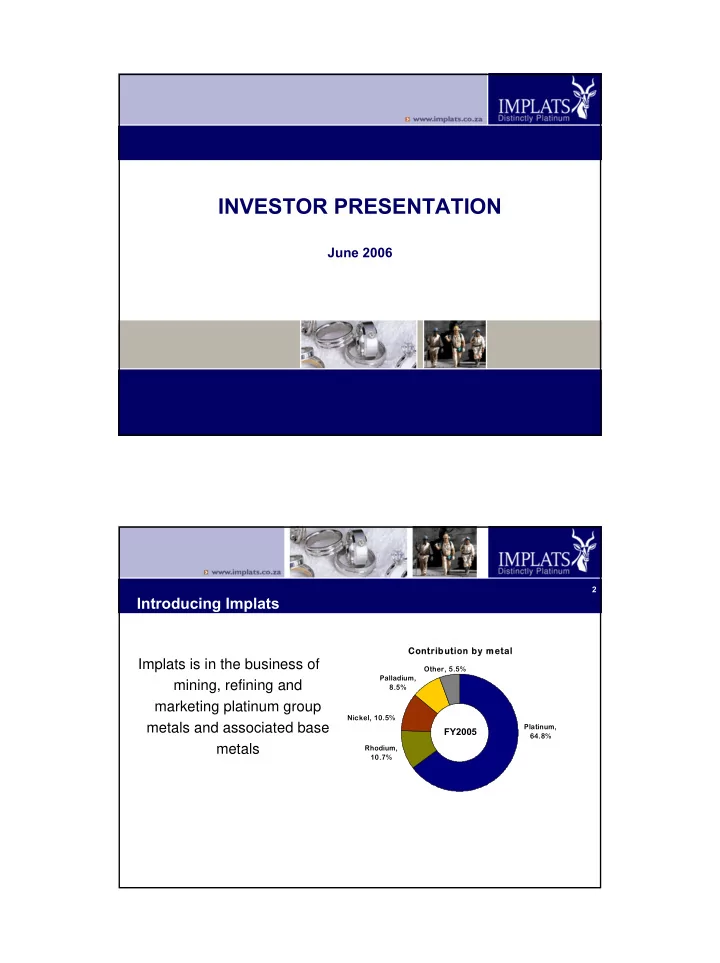
Implats is in the business of mining, refining and marketing platinum group metals and associated base metals

Cont

  • ntrib

ribution b

  • n by m

metal

Platinum, 64.8% Other, 5.5% Palladium, 8.5% Nickel, 10.5% Rhodium, 10.7%

FY2005

slide-2
SLIDE 2

3

  • 50.00

100.00 150.00 200.00 250.00

Implats …

  • is the premier global platinum investment
  • strives to

be the best platinum producing company and deliver superior returns to its shareholders

  • produced 1.848 million ounces of platinum in FY2005 equivalent to around

25% of global supplies (0.938 million ounces in first half FY2006)

  • Generated sales

revenue of R12.5 billion in FY2005 (R7.9 billion in first half FY2006

Share price (US$ equivalent)

2002 2006 2003 2004 2005 4

Key statistics

Implats

  • Has operations located on two prime PGM deposits
  • the Bushveld Complex in South Africa

(Impala Platinum, Marula Platinum and Two Rivers Platinum)

  • the Great Dyke in Zimbabwe

(Zimplats and Mimosa)

  • Impala Refining Services – toll-refining and third party processing
  • Strategic interest in Aquarius Platinum
slide-3
SLIDE 3

5

Location of operations and interests

6

Group structure

IMPLATS

Mine-to-market

  • perations

Impala Refining Services (IRS) Investments

Impala Platinum Zimplats Mimosa Toll refining Concentrate

  • fftake

agreements Two Rivers (100%) Marula Platinum

50% 86.9% 100%* 100% * 20% to be allocated to BEE ownership 45% Aquarius Platinum SA (20%) Aquarius Platinum (8.6%) 51%

slide-4
SLIDE 4

7

Platinum reserves and resources (attributable)

Impala Platinum, 35% Marula Platinum, 5% Zimplats, 57% Aquarius, 1% Two Rivers, 1% Mimosa, 2%

  • 215.1 Moz attributable reserves and

resources at as 30 June 2005

Market review

slide-5
SLIDE 5

9

Sales volume by metal

H1 2006 H1 2005 % change FY2005 Platinum (000oz) 833 803 4 1,562 Palladium (000oz) 440 394 12 826 Rhodium (000oz) 93 91 2 177 Nickel (000t) 6.7 7.0 (4) 14.6

10

6,000 6,500 7,000 7,500 8,000 8,500 9,000 9,500 10,000 10,500 FY01 FY02 FY03 FY04 FY05 H106 600 700 800 900 1,000 1,100 1,200 1,300 1,400 1,500

Strong dollar metal prices

R/Pt oz $/Pt oz

revenue received per Pt oz sold

slide-6
SLIDE 6

11

Prices achieved by metal

H1 2006 H1 2005 % change FY2005 Platinum ($/oz) 911 829 10 840 Palladium ($/oz) 207 221 (6) 208 Rhodium ($/oz) 2,260 1,001 126 1,217 Nickel ($/t) 14,218 13,945 2 14,592 $ revenue per Pt oz 1,452 1,227 18 1,279 Exchange rate (ave) 6.49 6.21 4.5 6.20 R revenue per Pt oz 9,423 7,620 24 7,930

12

The platinum story

  • Following the small surplus in 2004 the

market moved back into deficit in 2005

  • Slower than anticipated SA supply

growth

  • Demand fuelled by

Automotive

  • Growth in diesel vehicles in Europe
  • Enforcement of tighter emission

standards for light and heavy duty vehicles Jewellery

  • Resilient demand in high price

environment

Pl Platinum um d demand

Automobile, 47% Industrial (including investment), 23% Jewellery, 30%

FY2005

slide-7
SLIDE 7

13

growth fuel growth fuelled by d by s strong rong automotiv automotive dies diesel dema el demand nd

Platinum

CY99 CY00 CY01 CY02 CY03 CY04 CY05

  • 800
  • 600
  • 400
  • 200

200 400 CY99 CY00 CY01 CY02 CY03 CY04 CY05 CY06 100 200 300 400 500 600 700 800 900 1000 1100 1200

surplus/deficit 000oz price $/oz

14

The palladium story

  • Demand showing encouraging signs of recovery
  • Fuelled by substitution of platinum in gasoline engines and

introduction of palladium jewellery in China

slide-8
SLIDE 8

15

Palladium

above-grou above-ground stocks ca nd stocks cap price p price

  • 900
  • 600
  • 300

300 600 900 1200 1500 CY99 CY00 CY01 CY02 CY03 CY04 CY05 CY06 100 200 300 400 500 600 700 800

surplus/deficit 000oz price $/oz

16

The rhodium story

  • Market moved into deficit in 2005
  • Implementation of stricter NOx standards in gasoline engines; and
  • growth in the glass industry
slide-9
SLIDE 9

17

Rhodium

tigh tightening N tening NOx legisl egislation driving de tion driving demand mand

  • 50.00

0.00 50.00 100.00 150.00 200.00 CY99 CY00 CY01 CY02 CY03 CY04 CY05 CY06

  • 400

100 600 1100 1600 2100 2600 3100 3600 4100 4600

surplus/deficit 000oz price $/oz

Financial review

slide-10
SLIDE 10

19

Highlights – interim 2006

Period on period

  • Sales revenue up 28% to R7.9 billion
  • Revenue per platinum ounce
  • Up 24% in rand terms
  • 18% higher in dollars
  • Unit costs contained to a 4.2% increase
  • Group gross margin of 42%

20

Earnings & dividend – interim 2006

  • Headline earnings up 78% to R28.06 per share
  • Interim dividend doubled to R10.00 per share
  • Special dividend of R55.00 per share declared

HEPS

cps

1,000 2,000 3,000 4,000 5,000 FY2005 H1 2006 H1 H2 H1

1,000 2,000 3,000 4,000 5,000 6,000 7,000 FY2005 H1 2006

DPS

cps

H1 H2 H1

Spec Div

slide-11
SLIDE 11

21

Income statement

R million H1 2006 H1 2005 % change FY2005

Sales 7,920 6,188 28 12,541 Cost of sales (4,615) (4,167) (11) (8,318) Gross profit 3,305 2,022 64 4,223 Share of profit of associates 41 204 (80) 204 Royalty expenses (379) (231) (64) (415) Profit before tax 2,769 3,372 (18) 6,334 Profit 1,826 3,014 (39) 5,254 HEPS (cps) 2,806 1,581 78 4,325 DPS (cps) (excludes special dividend) 1,000 500 100 2,300

22

Headline profit by entity

R million H1 2006 H1 2005 % change Impala IRS 224 77 191 Marula (9) (34) 74 Zimplats 74 52 42 Mimosa 79 51 55 Lonplats

  • 36
  • Aquarius

41 (3) 1,467 Ambatovy (68)

  • Headline profit

1,842 1,051 75 72 872 1,501

slide-12
SLIDE 12

23

Group capex

Rm

  • Significant capital expenditure planned -
  • in excess of R11 billion over next five years

500 1000 1500 2000 2500 3000 FY2005 FY2006 FY2007 FY2008 FY2009 FY2010 Expansion Maintenance

Operational review

slide-13
SLIDE 13

25

Group safety

0.158 0.069 0.093 0.134 0.104 0.139 0.000 0.050 0.100 0.150 0.200 0.250

FY'01 FY'02 FY'03 FY'04 FY'05 H1 06

Fatal injury frequency rate (per million man hours) Lost-time injury frequency rate (per million man hours)

Lost Time Injury Frequency Rate

8.43 7.90 5.65 3.69 4.80 3.57 0.00 2.00 4.00 6.00 8.00 10.00 12.00

FY'01 FY'02 FY'03 FY'04 FY'05 H1 06

(per million man hours)

26

Group operational review – tonnes milled

000t H1 2006 H1 2005 % change FY2005 Group* 10,394 9,646 8 19,315 Impala 8,555 7,829 9 15,778 Marula 463 457 1 766 Mimosa 764 673 14 1,424 Zimplats 995 1,024 (3) 2,058

* Group includes 50% of Mimosa

slide-14
SLIDE 14

27

Group operational review – refined platinum production

000 oz H1 2006 H1 2005 % change FY2005 591 18 35 45 Other IRS 249 245 2 559 Group 938 880 7 1,848 1,115 8 547 21 31 28 (14) 25 61 15 82 39 Impala Marula Mimosa Zimplats

28

Group operational review – cost per platinum ounce

R/oz H1 2006 H1 2005 % change

(Refined) (In concentrate) (In concentrate) (In matte)

Group

(Refined)

4,749 4,557 (4.2) (4.5) 4,274 4,468 9,397 7.0 4,721 10,104 5,282 10.6 5,896 (14.7) 6,760 Impala Marula Mimosa Zimplats

slide-15
SLIDE 15

29

Location – South African mine-to-market operations

30

Impala Platinum

  • Record performance
  • Recoveries up 2.5% to 85%
  • Drill jig implementation – 6% efficiency improvement
  • BMR and PMR expansions to 2Moz platinum completed
  • PMR expansion to 2.3Moz platinum approved
  • 16 and 20 shafts ahead of schedule
slide-16
SLIDE 16

31

Impala – focus on costs through technology

  • Roll-out of drill jigs
  • 20% Merensky panels in FY05

60% Merensky panels in FY06 100% Merensky panels in FY07

  • Potential for 5-10% improvement

in overall mining efficiencies

32

Marula Platinum

  • Capital expenditure of R830

million

  • Cash break-even achieved
  • Footwall project five months

ahead of schedule

  • Transition to owner-mining
  • efficiencies improved, but

hampered by sporadic industrial action

Mill feed grade

3.50 3.60 3.70 3.80 3.90 4.00 Apr-Jun Jul-Sep Oct-Dec

Tonnes broken per shift

1,500 2,000 2,500 3,000 3,500 4,000 Apr-Jun Jul-Sep Oct-Dec

t/shift

slide-17
SLIDE 17

33

Two Rivers Platinum

  • Capital expenditure of R1.2 billion (45% attributable)
  • Production start-up ahead of schedule - July 2006
  • Steady state of 120,000 platinum ounces per annum

in late 2007

34

Location – Zimbabwean mine-to-market operations

Victoria Falls

slide-18
SLIDE 18

35

Zimplats

  • Transition to underground

mining operations underway

  • Feasibility study on expansion

to 145,000 ounces platinum to be submitted to May board

  • Incremental growth planned for

longer term

T

  • nne s mine d

100 200 300 400 500 600 700 Apr - Jun Jul - Se p Oc t - De c '000 tonne s Ope nc a st Unde r g round

Gra de

2.7 2.9 3.1 3.3 3.5 3.7 Apr - Jun Jul - Se p Oc t - De c g / t Ope nc a st Unde r g r

  • und

36

Mimosa

  • Expansion to 80 000 platinum oz on track for May commissioning
  • Potential for further expansion to 130 000 platinum oz
  • JV with Aquarius
slide-19
SLIDE 19

37

Impala Refining Services

  • Undertakes processing of third party material
  • toll-refining activities and concentrate purchases
  • One of the world’s largest refiners of spent autocatalysts
  • Headline production of 733,000 oz of platinum in FY2005
  • Planned growth of 10% per annum

IRS plat IRS platinu inum prod product uction

  • n

100 200 300 400 500 600 700 800 900 1000 FY01 FY02 FY03 FY04 FY05 Lonplats

38

Aquarius Platinum

  • Equity-accounted earnings from Aquarius
  • Production up 15% in FY2005
  • Contributes to IRS
  • Three mines –
  • Kroondal at peak performance and
  • Marikana ramping up
  • Everest commenced production in December 2005

(scheduled to produce 145,000 oz of platinum pa)

slide-20
SLIDE 20

Corporate Activity

40

Corporate Activity

  • Implementation of BEE transaction
  • Agreed Ni-Cu-PGE joint venture with Jubilee on Ambodilafa
  • Initiated a smelter expansion project that could ultimately increase

capacity to 2.8 million oz of platinum

slide-21
SLIDE 21

41

Two-tier empowerment structure

  • Anchor empowerment partner –RBR
  • RBR will gain a direct holding of approximately

9% in Implats

  • Transaction includes Local Economic Development Trust

with the primary obj ective of uplifting local communities and women in particular

  • Employee S

hare Ownership Programme (ES OP) – 3% holding in Implats

42

Structure of RBR transaction

RBR

Third party funders

Implats

External funding

existing holding: 1.4%

IRS UJV IRS business 51% Stake to be converted into ≈ 7.4% Implats shares within 10 years 49%

IRS

100%

Net position after 10 years ≈ 9%

5.5 million ‘A’ shares

slide-22
SLIDE 22

43

Employee Share Ownership Scheme (ESOP)

  • Implats makes capital contribution to ESOP trust
  • R1.8 billion to purchase 2.05 million (3%) Implats shares
  • equivalent to 25% of total transaction
  • 28,304 eligible employees (Patterson A,B and C grades)

including 26,962 HDSA employees

  • Eligible employees benefit from capital appreciation
  • ver 10 years, but with full voting rights from day one
  • Net proceeds (after capital contribution repayment to Implats

and tax) to be paid equally to all eligible employees

44

Provides in excess of 26% BEE ownership

RBR: Existing shareholding 2.4% This transaction 12.3% From ESOP 4.7% Credits from Incwala transaction 7.1% Total 26.5% Impala Platinum will achieve empowerment credits from three sources, based on units of production in FY2006

slide-23
SLIDE 23

45

Current status

  • Legal agreements concluded in May 2006
  • Conditions outstanding include:
  • DME approval
  • Competition Board approval
  • Shareholder approval
  • Bank financing

Conclusion

slide-24
SLIDE 24

47

Prospects

  • Robust PGM market
  • Increase in production to

2.3 million platinum ounces by FY2010 on track

  • Significant further upside

potential in Zimbabwe

  • Safety, cost containment and

grade management remain

  • perational priorities
  • Highly cash generative
  • Good dividend yield

500 1000 1500 2000 2500 FY00 FY05 FY10 Mine to m arket 3rd party processing Lonplats Zim babw ean expansions

INVESTOR PRESENTATION

June 2006