SLIDE 11 21
1.2 0.7 0.5 0.8 Sep 08 Mar 09 Sep 09 Mar 10*
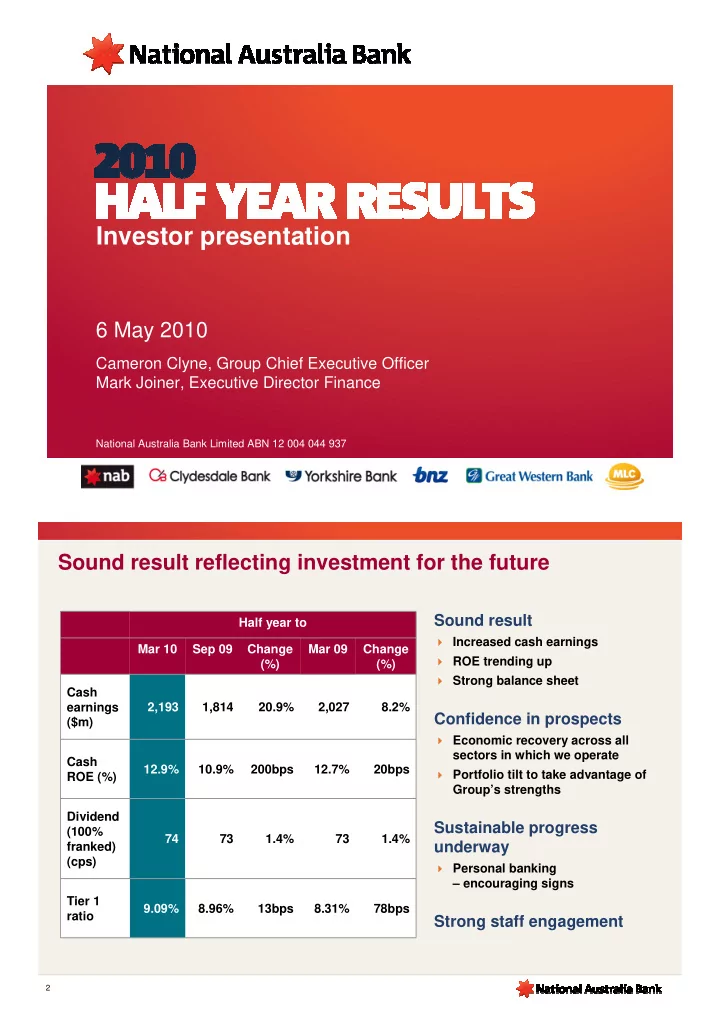
Personal Banking
MFI customer satisfaction1 Home loan share of system growth3 Net transaction account growth Sweeney research brand tracker2
69.1 69.0 70.8 72.8 75.4 74.1 74.1 73.0 Sep 08 Mar 09 Sep 09 Mar 10
NAB Weighted average of 3 major bank peers
7,570 13,066 15,755 79,911 Sep 08 Mar 09 Sep 09 Mar 10
(#) Personal Banking multiple of system
* Not tracked in Sep 09.
Open and upfront Transparent with fees and charges Customers are at an advantage A bank for people like me A leader in making banking fairer*
Sep 09 March 10
NAB Score Average of 3 major bank peers
30% 35% 34% 33% 39% 39% 40% 36% 35% 39% 40% 41% 39% 38% 32% 38% 38% 38%
(1) Roy Morgan Research, Australian Main Financial Institution Population aged 14+, 6 month moving average. Customer satisfaction is based on customers who answered very/fairly satisfied. (2) Sweeney Research Brand Tracker as at March 2010 (3) RBA Financial System
(%)
* Includes Advantedge
22
Markets Income
Wholesale Banking
Specialised Finance & Debt Markets – Supporting Australia’s nation-building agenda Asset Servicing – Australia’s #1 Securities Custody business by market share Global Markets – positioned for
Markets Sales – Partnering with Business Banking
420 490 538 883 656 611 329 Mar 07 Sep 07 Mar 08 Sep 08 Mar 09 Sep 09 Mar 10
CAGR 22%
($m)
Significant
investment in products and capability
Strengthening
relationships
Improvements
in risk control, technology and
platforms Market Recognition: Australia 2009/2008/2007:
Cross Border “Top Rated” Leading Client “Top Rated” Domestic “Commended”
New Zealand 2009/2008:
Cross Border “Top Rated” Leading Client “Top Rated”
Source: Accreditations: Global Custodian – Annual Agent Banks in Major Markets Survey Results
Growth in fund management pools to provide ongoing
Total Assets Under Custody for Australian Investors – Dec 2009 (up from 24.0% at Dec 2007)
Source: Australian Custodial Services Association
32.4% 67.6%
NAB Other #1 for interest rate swaps sales Co-locating product specialists in Business Banking Centres Targeted FX campaign resulted in an additional 859 FX customers (March 2010 half year)
Source: East & Partners Australian Corporate Banking Markets – January 2010 survey
Market Share %
Strong capability as evidenced
by market recognition *
Infrastructure investment in
Australia expected to be
- approx. $770bn over the next
decade
Lead financing role in Victorian
desalination plant and Peninsula Link projects
* 22 awards received in March 2010 half year ; #2 on Dealogic’s mandated lead arranger league table for Australasian project finance deals.
12.0 14.0 16.0 18.0 20.0 22.0 24.0 Jan 03 Jan 04 Jan 05 Jan 06 Jan 07 Jan 08 Jan 09 Jan 10
Interest Rate Swaps
Peer 1 Peer 2 NAB Peer 3
* 2007 based on indicative restatement data