
SLIDE 1
Investor Presentation InvestorPresentation
ThomasHoyer,CEO
1
May2012 www.ruukkigroup.com
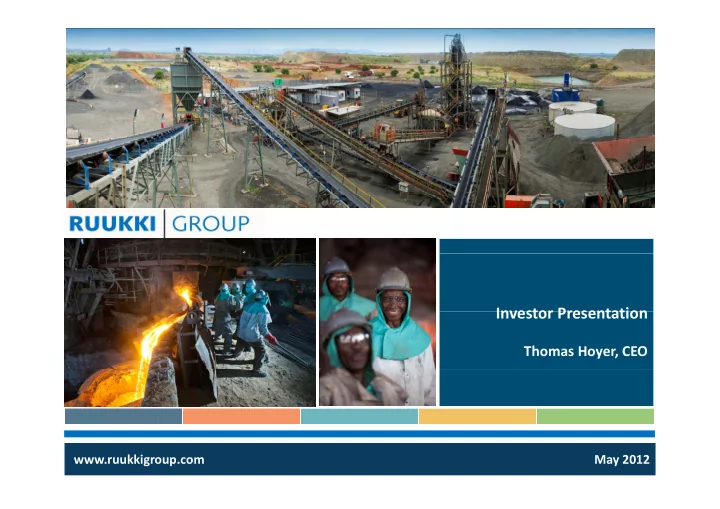
Investor Presentation Investor Presentation Thomas Hoyer, CEO - - PowerPoint PPT Presentation
Investor Presentation Investor Presentation Thomas Hoyer, CEO www.ruukkigroup.com May 2012 1 Introducing Ruukki Introducing Ruukki A vertically integrated ferroalloys producer Ruukki Group HQ from mine to
1
May2012 www.ruukkigroup.com
from mine to customer
RuukkiGroupHQ
stainless steel industries
LSE: RKKI OMX Helsinki: RUG1V
general market demand Offers protection in challenging markets
profitability & growth
FerroAlloys SouthAfrica SpecialityAlloys Turkey&Germany Sales&Marketing Malta ChargeChrome SilicoManganese StainlessSteelAlloy Chrome ore LowCarbon UltralowCarbon SpecialityLowCarbon Chrome ore GlobalClientBase
2
Chromeore Chromeore
009 pa s o to Sout ca
Finland EWW G EWW, Germany TMS, Turkey RCS, Malta Mining Processing Sales & Sales & Marketing Mogale, South Africa Stellite, South Africa
3
Current Assets Mid term Growth Initiatives Long term Growth Themes
Current Assets Mid-term Growth Initiatives Long-term Growth Themes
M&A
4
Group Financial Performance
FY2011 FY2010 FY2011 FY2010
159.1 123.3 1.4 -8.4 0 9 6 8 EBITDA margin (%)
0.9 -6.8
Production (tonnes): Key Achievements: FY2011 FY2010 Mining 74,489 51,985 Production up 157% g , , Processing 16,678 35,823 Revenue up 29% EBITDA improved by EUR 9.8 million to 1.4 million 353,962t FY 2011 Stellite successfully ramped-up to 360,000tpa RoM annualised Good performance by Speciality Alloys division FY 2010 137,951t FY 2011 Good performance by Speciality Alloys division FY 2010
5
Financial Performance
FY 2011 FY2010 FY 2011 FY2010
83.6 69.0 13.8 7.8 16 5 11 3 EBITDA margin (%)
16.5 11.3
neg. neg. Production (tonnes): Key Achievements: FY2011 FY2010 Mining: 82,154 54,917
Processing: 25,908 17,994
time & within budget
increased by 44% 72,911t 108,062t 2011 2010
6
Financial Performance
FY 2011 FY2010 FY 2011 FY2010
75.4 54.0
neg neg EBITDA margin (%)
Production (tonnes): Key Achievements: FY 2011 FY2010 Mining: 159,455 n/a
processing plant Processing: 86,445 65,040 processing plant
65,040t 245,900t 2011 2010
7
Group Financial Performance
Q1 2012 Q1 2011 Q1 2012 Q1 2011
46.7 34.8 2.8 3.5 6 0 9 9 EBITDA margin (%)
6.0 9.9
Production (tonnes): Key Achievements: Q1 2012 Q1 2011 Mining 74,489 51,985
g , , Processing 16,678 35,823
demand & low prices 91,167t Q1 2012
market conditions
Q1 2011 87,808 Q1 2012 g p y electricity buy-backs Q1 2011
8
1,4 2,80
Product Prices (US$/lb)
1,25 1,3 1,35 1,4 2,60 2,80 FeCr 1,1 1,15 1,2 1,25 2,20 2,40 ChCr Low Carbon 1 1,05 , 2,00 , Q1/10 Q2/10 Q3/10 Q4/10 Q1/11 Q2/11 Q3/11 Q4/11 Q1/12 Low Carbon FeCr ChCr
9
Speciality Alloys (TMS & EWW) FerroAlloys FerroAlloys (Mogale)
10
Our Target is Zero Harm to Our Employees, Our Local Communities and Our Environment
11
Stellite mine
processes across all the Group’s operations processes across all the Group’s operations
12
Our community projects are focused on supporting children with much-needed nutritional and educational support
13
p p g , g p g g conditions
14
Ruukki is well positioned to weather the current challenging market conditions with integrated operations from mine to customer a integrated operations from mine to customer, a diversified product range and strong growth prospects.
15
16
Sharesinissue 248,432,000 Market Cap (14 May £145m %
MajorShareholders
MarketCap(14May 2012) £145m €191m YearEnd 31December Brokers Investec/RBC KERMAS 29 ATKEY 21 FINALINE 11 HINO RESOURCES 6 LSE 52wkhigh 52wklow RKKI 152p 58p OMX Helsinki RUG1V HINORESOURCES 6 MARKKUKANKAALA(Founder) 3 MONCHEUR&CIE 3 VEIKKOESAHUKKANEN(Founder) 2 OMXHelsinki 52wkhigh 52wklow RUG1V €1.65 €0.71 HANWA 1 ManagementTeam AnalystCoverage a age e t ea
ThomasHoyer CEO DrDankoKoncar EnterpriseDirector DrStefanoBonati ChiefCommercialOfficer
TimHuff RBCCapitalMarkets HunterHillcoat Investec
MarkusKivimäki GeneralManager:CorporateAffairs&Company Secretary KalleLehtonen GeneralManager:Finance Dr Alistair Ruiters Executive Chairman, Ruukki South Africa 17 DrAlistairRuiters ExecutiveChairman,RuukkiSouthAfrica
18
BusinessUnit Mines Processing Plants ProcessingPlants Partners 19