
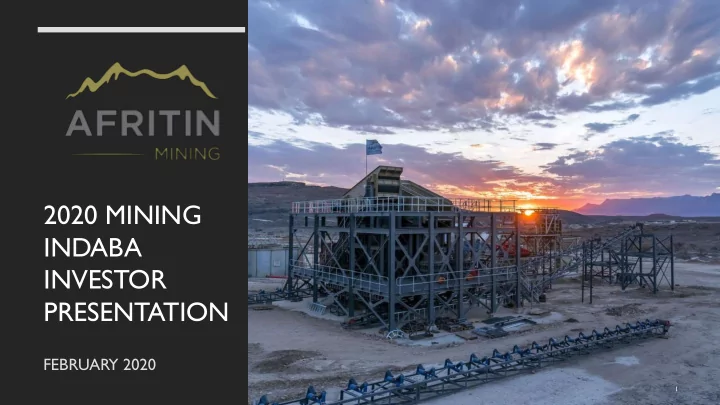
SLIDE 1
2020 MINING INDABA INVESTOR PRESENTATION
FEBRUARY 2020
1
INVESTOR PRESENTATION FEBRUARY 2020 1 DISCLAIMER These - - PowerPoint PPT Presentation
2020 MINING INDABA INVESTOR PRESENTATION FEBRUARY 2020 1 DISCLAIMER These presentation slides (the Slides) do not comprise an admission document, listing Any investment, investment activity or controlled activity to which the Slides
FEBRUARY 2020
1
2
These presentation slides (the “Slides”) do not comprise an admission document, listing particulars or a prospectus relating to AfriTin Mining Limited (“the Company”) or any subsidiary of the Company, do not constitute an offer or invitation to purchase or subscribe for any securities of the Company and should not be relied on in connection with a decision to purchase or subscribe for any such securities. The Slides and the accompanying verbal presentation do not constitute a recommendation regarding any decision to sell or purchase securities in the Company. The Slides and the accompanying verbal presentation are confidential, and the Slides are being supplied to you solely for your information and may not be reproduced or distributed to any other person or published, in whole or in part, for any purpose. No reliance may be placed for any purpose whatsoever on the information contained in the Slides and the accompanying verbal presentation or the completeness or accuracy
contained in the Slides and the accompanying verbal presentation, and no liability is accepted for any such information or opinions (including in the case of negligence, but excluding any liability for fraud). The Slides contain forward-looking statements, which relate, inter alia, to the Company’s proposed strategy, plans and objectives. Such forward-looking statements involve known and unknown risks, uncertainties and other important factors beyond the control of the Company that could cause the actual performance or achievements of the Company to be materially different from such forward-looking statements. Accordingly, you should not rely on any forward-looking statements and the Company accepts no obligation to disseminate any updates or revisions to such forward-looking statements. The Slides and their contents are directed only at persons who fall within the exemptions contained in Articles 19 and 49 of the Financial Services and Markets Act 2000 (Financial Promotion) Order 2005 (such as persons who are authorised or exempt persons within the meaning of the Financial Services and Markets Act 2000 and certain
companies, unincorporated associations or partnerships, the trustees of high value trusts) and persons to whom distribution may otherwise lawfully be made. Any investment, investment activity or controlled activity to which the Slides relates is available only to such persons and will be engaged in only with such persons. Persons of any other description, including those that do not have professional experience in matters relating to investments, should not rely or act upon the Slides. The Slides should not be distributed, published, reproduced or otherwise made available in whole or in part by recipients to any other person and, in particular, should not be distributed to persons with an address in the United States of America, Australia, the Republic of South Africa, the Republic of Ireland, Japan or Canada or in any other country
regulatory requirement. No securities commission or similar authority in Canada has in any way passed on the merits
No document in relation to the placing of the Company shares has been, or will be, lodged with, or registered by, The Australian Securities and Investments Commission, and no registration statement has been, or will be, filed with the Japanese Ministry of Finance in relation to the placing or the Company’s shares. Accordingly, subject to certain exceptions, the Shares may not, directly or indirectly, be offered or sold within Canada, Australia, Japan, South Africa or the Republic of Ireland or offered or sold to a resident of Canada, Australia, Japan, South Africa or the Republic of Ireland. The Securities have not been, and will not be, registered under the United States Securities Act of 1933, as amended (the “US Securities Act”) or with any securities regulatory authority
the United States or to, or for the account or benefit of, any US Person as that term is defined in Regulation S under the US Securities Act. The Company has not been registered and will not register under the United States Investment Company Act of 1940, as amended. The Slides and their contents are confidential and should not unless otherwise agreed in writing by AfriTin Mining Limited be copied, distributed, published or reproduced (in whole
3
4
CURRENT PLANT
A tin mining company with a portfolio of production and near production tin assets in Africa
Uis Tin Mine – Namibia (production) – previously the worlds largest open cast tin mine
Mokopane Tin Project – South Africa
Listed on AIM November 2017
London's ONLY pure play listed tin company
Experienced Management team
Management carries over 120 years’ experience
From listing on AIM to first production in two years
Objective to become the tin champion
Well placed to benefit from the tin supply shortage
5
STRATEGIC PRINCIPLES STRATEGIC OBJECTIVES 2020 Scalable
Large mining licence area with over 180 mineralised, outcropping pegmatites
The right commodity
Sound market fundamentals, supporting stable commodity price outlook
Low cost curve
First quartile cash-cost curve for Phase 2
Early production
Phased development approach allows for early cash flows, while significantly de-risking Phase 2
DELIVERY OF FIRST SHIPMENT OF CONCENTRATE PHASE 2 SCOPING STUDY IN REVIEW ACHIEVE STEADY STATE PRODUCTION PHASE 2 PFS AND BFS IDENTIFY AND EXPLORE OTHER TIN OPPORTUNITIES
2,8 3 3,2 3,4 3,6 3,8 4 4,2 4,4 4,6 4,8 5 Share Price (GBP)
Mid close 6
T
INSTITUTION HOLDING % STAKE Naminco Limited 91 931 731 14,1% The Orange Trust 64 874 704 9.9% Bushveld Minerals Limited 51 995 342 8,0% Hargreaves Lansdown 41 804 994 6.4% Acacia Resources Limited 40 642 121 6,2% Premier Miton Group PLC 31 328 044 4,8% Capital International IOM 25 348 074 3,9% Mr Stephen Pycroft 22 193 851 3,4% Interactive Investors 18 877 859 2,9% Mr Brendan M Kerr 16 373 333 2,5% T
405 370 053 62,06% Management 21 552 448 3.3% Others 226 223 872 34,64%
T
653 146 373 100%
Ticker ATM Market AIM Shares in issue 653 146 3731 Market cap £ 19,6m1 Cash and cash equivalents £ 0.9m2 Working Capital Facility (Undrawn) £ 2m
1AS AT 18 DECEMBER 2019 2AS AT 18 DECEMBER 2019
Key metrics
Market overview
Refined tin consumption of c.340-370ktpa makes it a relatively small market with China accounting for most of demand growth
Production cuts from several Chinese smelters in 2016 further exacerbated what was already a prolonged deficit
Tin has the shortest reserve life among base metals (16 years)
7
Global tin use by application, 2018
47% 18% 13% 6% 6% 10% Solder Chemicals Tinplate Lead-acid batteries Copper Alloy Other
Outlook for tin usage
SOURCE: ITA SOURCE: ITA
8
Apex developing in physical supply constraints as a result of:
Closure of Chinese production plants in Yunnan
Reduced exports from Myanmar
Environmental and regulatory hurdles in Indonesia
Depleting resources and grades from Latin America supply
Refined tin demand currently outpaces supply (000t)
SOURCE: ITA
Global mine production by region Growth in global mine production – 2019 vs 2023
9
SOURCE: MIT
Critical to energy revolution
Emerging market opportunity for tin in lithium-ion batteries
Electric vehicles are the largest potential growth sector for lithium- ion batteries
International Tin Association reporting demand could triple by 2050
Indium Tin Oxide (ITO) is used in touch screens and display technologies such as LCD, plasma
Global touchscreen controller market expected to grow from $5bn in 2016 to $15bn in 2023
Salt PGM (Pt,… Zinc Niobium Graphite Vanadium Tungsten Gold Nickel Silver Cobalt Lithium Tin
AV/EV Robotics Renewables Oil & Gas Energy Storage IT Other
Electrical contact materials Tin, silver, gold Battery materials Lithium, cobalt, nickel, zinc (tin, silver, vanadium, graphite)
15 000 16 000 17 000 18 000 19 000 20 000 21 000 22 000 23 000 24 000 2013 2014 2015 2016 2017 2018 2019f 2020f 2021f 2022f 2023f LME Tin price, US$/t
Tin Price Outlook
Extended Trade War Central Forecast Rapid Recovery Extended Trade War w/ Rebound
Forecast range 2020 to 2023: $18,500 – $24,000
SOURCE: ITA
10
11
AfriTin’s portfolio includes an interest in a number of mining and exploration areas across Southern Africa
Tin Provinces of Africa AfriTin assets Tin, Nb and Tu
Bushveld, South Africa Damara, Namibia
Mining Licences
Uis: ML134
C1/B1: ML 129
Nainais: ML133
Exploration Licences
Brandberg West: EPL5445
Goantagab: EPL5670
Prospecting Rights
Mokopane Tin
2205PR
2371PR
12
Historical mining footprint only a fraction of existing licence areas in a proven tin province. AfriTin aims to expand the company's footprint across the region.
EPL 5445 EPL 5670 ML 134 ML 129 ML 133
SOURCE: GOOGLE EARTH
Uis Project
Brandberg West: Exploration licence EPL5445 covering 30 089 Ha
Historically producing tin-tungsten deposit from the 1940’s 1980’s, owned by SWACO, a Goldfields subsidiary
Exploration programme planned for 2020
Goantagab: Exploration licence EPL5670 covering 18 950 Ha
Uis: 3 fully permitted mining licences ML129, ML133, ML134 with a combined coverage of 27 860 Ha
Historically the largest hard-rock tin mine in the world
Operating in excess of 3 decades
Historic production rates of ~1 500 tonnes Sn concentrate per annum
Large scale, conflict-free deposit located in mine friendly Namibia
Mining licences in place
Tin mineralisation complimented by significant by-product potential including
Lithium
Tantalum
Rare earth elements (REE’s)
2 phase development plan
Phase 1 (Tin only): Plant fully operational and undergoing ramp- up
Phase 2 (multi-commodity: Tin, Lithium, Tantalum): studies in progress
13
CURRENT PLANT
HISTORIC CIRCA 1989
CURRENT PLANT
14
Discovery of the asset Asset is acquired by Mr Angus Munro; Uis Tin Mining Co (SWA) is established and large-scale mining commences Imcor acquires the asset and installs a c. 35tph tin recovery plant to produce cassiterite concentrate Imcor enlarges the plant to
building the village of Uis Imcor enlarges the plant to c. 140tph producing c. 100-120 tpm cassiterite Uis Tin Mine closes following the tin price collapse in the mid-1980s SRK publishes a ‘LoM Plan Report for 1989- 2063’*. These were historical estimates that were not reported to any recognised minerals industry reporting code Greenhills (Bushveld subsidiary) purchases 85% stake from AfriTin Mining Namibia1
1 Was renamed to AfriTin Mining Namibia in January 2019 (between 2014 and 2016 the entity was called Dawnmin Africa
Investments)
2017 AfriTin lists on AIM with Uis as its flagship asset
H i s t o r i c e s t i m a t e o f U i s * Tonnes (kt) Grade (Sn %) Contained Sn (t) Proven Reserve 48,426.8 0.136 65,860 Probable Reserve 21,896.9 0.135 29,561 Total 70,323.8 0.136 95,421 *Non JORC-Compliant; Source SRK report 1989
2016 1911 1958 1966 1980 1948/51 1990 1989
Concurrent exploration programmes are targeting higher grade pegmatites with low stripping ratios to maintain mining stockpiles and reduce expenditure
Regional mapping programme completed on surrounding pegmatites – visual confirmation of cassiterite mineralisation for over 180 pegmatites within 5km of processing plant
Detailed mapping programme has identified higher grade greisenised areas within mineralised pegmatites
Ore bodies are up to 80m thick and over 1km along strike
67-meter intersection of the W17 pegmatite, south of mining area, displayed visible cassiterite grains over the entire intersection
Historical pits mined on outcropping pegmatite,
SRK reserves (1989)
15
SOURCE GOOGLE EARTH
16
141 drill holes over V1 V2 V1 V2 pegmatites
Multiple mineralised pegmatites mapped
Historical IMCOR drill data for V1 and V2 pegmatites has been validated by AfriTin’s Phase 1 exploration programme, allowing incorporation into geological modelling
141drill holes along a 25m grid spacing utilised for high resolution modelling
Phase 1 weighted averages used for pegmatite intersections
V1 and V2 pegmatite intersections occur at depth
Drill data shows significant down dip thickening of the ore body compared to surface outcrop
3-D geological model completed and a maiden resource declared
Utilised for block modelling and mine design
MRE of Tin within the V1 and V2 pegmatites (cut-off grade 0.05% Sn)
Measured Indicated Inferred TOTAL Commodity
Sn Sn Sn Sn
Grade
0.139% 0.136% 0.130% 0.134%
T
21 540 000 13 050 000 36 950 000 71 540 000
Contained Metal (t)
29 899 17 765 47 875 95 539
MRE of ancillary elements within the V1 and V2 pegmatites
Inferred Commodity
Li2O Ta
Grade
0.63% 85 ppm
T
71 540 000 71 540 000
Contained Metal (t)
450 265* 6 091
* Metal refers to Li2O
Globally significant maiden resource
17
Drill results validated the historical exploration data generated by ISCOR subsidiary IMCOR, allowing an additional 141 drill holes to be incorporated into the mineral resource estimate
Ancillary elements analysed during the drilling campaign confirmed Ta and Li by- product potential
The ancillary elements reported as part of the mineral resource on a lower confidence level (inferred) as these minerals were not sampled for in the historical ISCOR data
The maiden resource is comprised from only
V1V2
18
The combined mine plan delivers 2.75 million tonnes (represents 3% of the historical resource) of pegmatite at an average waste stripping ratio
Mine design, at 0.5 Mtpa RoM, provides sufficient inventory to supply Phase 1 processing plant with ore for more than 5 years
Mine design exploits outcropping pegmatites and excavations of the historical Uis mine
Potential for fast production ramp-up
Conventional open-pit mining with excavator-truck combination mining method
Current RoM ore stockpile exceeds 2 months production supply
V2 Pegmatite V1 Pegmatite Hanging Wall Person for Scale
Coarse grained allowing for easy liberation of tin through crushing
Plant design targets Sn recoveries >60% at concentrate grades of >60% Sn
Efficient pre-concentration with dense medium separation (DMS) produces 80% waste rejection at high recoveries.
Large material density differentials (cassiterite/columbite > 5.0 g/cm
3, gangue
2.7 g/cm
3) allowing for efficient dense
medium and gravity separation.
Tantalite associated with the concentrate
Preliminary lithium test work indicate potential for lithium byproduct. Further test work planned.
19
Final concentrate drying First tin metal product Sn Phase One Concentrate Coase grained
Sn Concentrate
20
21
Formal (10 year) supply agreement concluded with Namibia Power Corporation:
― Provides for the full on-site power requirements for Phase 1
mining and processing facility
― Significantly more cost effective than diesel generated power Supply voltage of 66 kV Supply capacity of 1.5MVA
Diesel generators currently in place to serve as backup power
Water supply
― Geohydrological study, water drilling and test pumping
completed
― Results of the programme have confirmed the viability of using
groundwater sources for Phase 1
Achieved a JORC-compliant mineral resource estimate (MRE) September 2019
Processing plant production of tin concentrate commenced August 2019
Offtake agreement signed with Thaisarco for 12 months with the option to extend
1st shipment dispatched from Uis Tin Mine end of November 2019 and due to arrive in port in Thailand early February 2020
2nd shipment planned for end of January 2020
Ramp-up to nameplate capacity of 60 tonnes Sn concentrate per month, targeted for end of Q2 2020
Lithium mineralisation identified and being investigated for potential as an additional revenue stream
Pre Economic Assessment (PEA) for Phase 2 of the project nearing completion
22
Phase 1 – Finalise proof of concept:
Study for Phase 2
Phase 2 – Leverage production profile to expand the
Study
regional area
a bigger plant
elsewhere in Africa
23
Clear development timeline with catalysts for value creation:
Fully permitted operation
Production commenced August 2019
V1 V2 resource JORC-compliant
Scoping Study nearing completion
Commencement of BFS scheduled for 2020
Junior mining company that delivers
Strong geological potential from a historically producing mine
Multi-commodity optionality via regional expansion
A stable mining investment jurisdiction
Strong medium-term demand for tin underpinned by growing applications in new technologies
24
25
26
Roger Williams Non-executive Director
Sylvania Platinum and Digby Wells and Associates
Glen Parsons Chairman
July 2017
Anthony Viljoen CEO
T erence Goodlace Non-executive Director
Ore Limited
Laurence Robb Non-executive Director
Institute, University of the Witwatersrand’s School of Geosciences
Frans van Daalen COO
experience
Machiel Odendaal Lead Engineer
Engineer at various mining operations in Southern Africa
Timothy Marais Exploration Manager
project development, management and near-term value realisation
Jan Rabe Lead Process Engineer
various technical management roles
Rob Sewell CFO
experience across various industries
experience during a secondment to Deloitte Sydney office
Road between Uis and Walvis Bay Walvis Bay Port upgrade completed
27
Complimentary mining and exploration jurisdiction with a developed transport infrastructure
Stable democracy with an independent, strong legal system
Country encourages foreign investment
Long established Mining Act – mining law in Namibia is mainly regulated by the Minerals Act 33 of 1992 which was amended in 2008
Mining is the biggest contributor to Namibia’s economy in terms of revenue and consequently, an important industry
Fraser Institute lists Namibia No. 60 globally in terms of investment attractiveness and No. 36 globally in policy
5
th most transparent country in Africa
27
Continue to engage with the local partners and communities
A strong focus is placed on consistent participation and communication between the community and AfriTin
Honourable Tom Alweendo, Minister of Mines and Energy, plus analysts and investors, hosted at site establishment ceremony, December 2018
Significant support shown by Ministry of Mines
Excitement around expected economic benefits to the region
28
29
Mokopane Tin Project – located on the northern limb of the Bushveld Complex
Prospecting right 2205PR covering six farms (13 253 Ha)
Prospecting right 2371PR covering three additional neighbouring farms (awaited)
Four targets identified, exploration conducted on two targets to date, with 18 447 tonnes contained Sn resource established
Scoping Study completed October 2014
― Base case RoM of 691ktpa to produce ~700tpa of
99.5% Sn purity metal, yields positive economics with a significant IRR of 34.6%
― Low quartile operating costs: $14,276/tonne
Potential additional 5,000 tonnes contained Sn resource in the underground lease target area
Greenhills interest = 74%, 26% held by local Black Economic Empowerment partners
Mokopane tin project
30
Registered office 18 – 20 Le Pollet St Peters Port Guernsey Representative office 2nd Floor, Building 3 Illovo Edge Office Park Corner Harries & Fricker Road Illovo Johannesburg, 2116 South Africa
Anthony Viljoen, CEO info@afritinmining.com www.afritinmining.com
Broker & Nominated Advisor WH Ireland 24 Martin Ln London EC4R 0DR United Kingdom Joint Broker 8-10 Grosvenor Gardens London SW1W 0DH United Kingdom Investor Relations – UK 1 Cornhill London EC3V 3ND United Kingdom +44 (0) 20 7920 3150 Corporate Advisor and Joint Broker 2 Park Street London W1K2HX United Kingdom 55 Baker street Marylebone London W1U 7EU United Kingdom