
SLIDE 1
Introduction to Machine Learning Evaluation: Measures for Regression - - PowerPoint PPT Presentation
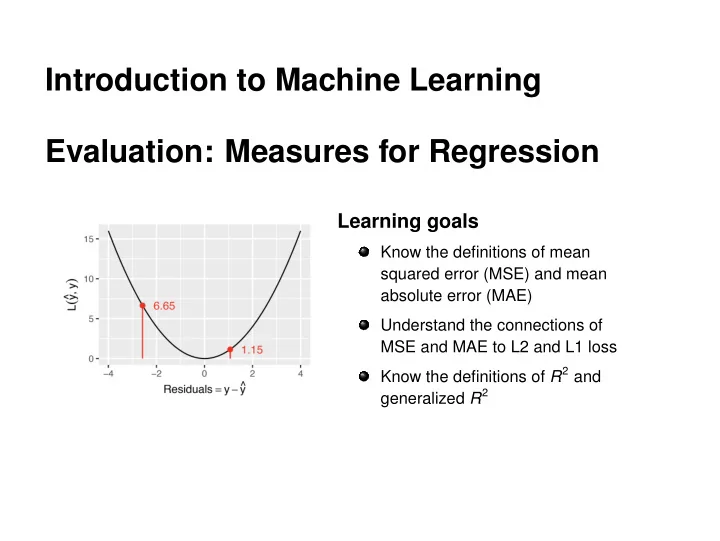
Introduction to Machine Learning Evaluation: Measures for Regression Learning goals Know the definitions of mean squared error (MSE) and mean absolute error (MAE) Understand the connections of MSE and MAE to L2 and L1 loss Know the
n n
6.65 1.15
1 2 3 4 5 6 7 2 4
x y 6.65 1.15
5 10 15 −4 −2 2 4
Residuals = y − y ^ L(y ^, y)
c
n n
2.58 1.07
1 2 3 4 5 6 7 1 2 3 4 5
x y 2.58 1.07 6.65 1.15
5 10 15 −4 −2 2 4
Residuals = y − y ^ L(y ^, y)
c
n
n
c
c