
SLIDE 1
/
/ IntrinsicAutoRegressieModels Spaial daa anali in San Se - - PowerPoint PPT Presentation
/ IntrinsicAutoRegressieModels Spaial daa anali in San Se Mae Daa Sciei a The Rckefelle Fdai / H! Se Mae, Manage and Daa
/
/
Se Mae Daa Sciei a The Rckefelle Fdai
/
Peiol, a a Daa Scieni a BFeed and a Saiical geneici a The Feinein nie fo Medical Reeach Hold a Gadae Diloma in Saiic and Sochaic Pocee fom he Uniei of Melbone, Aalia. · · ·
3/43
/
4/43
/
5/43
/
6/43
/
7/43
/
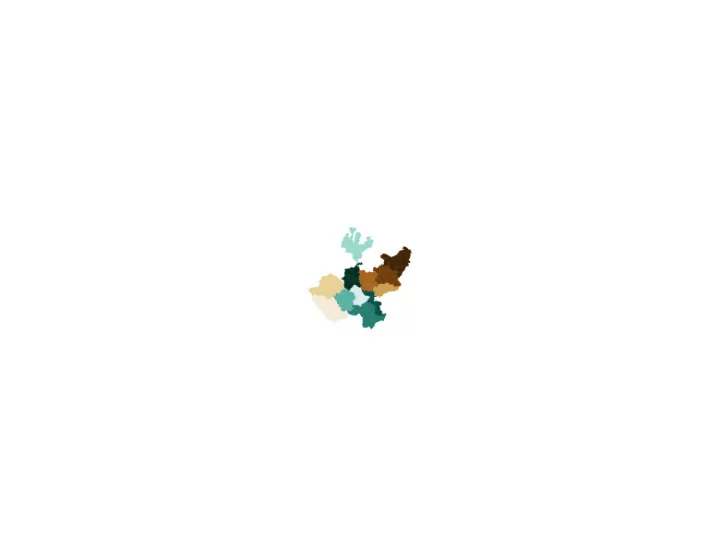
Jalisco Polygon (https://datos.jalisco.gob.mx/dataset/mapa- general-de-jalisco-limite-estatal)
8/43
/
MDE Jalic (h://elan.a.jalic.gb.m/mide/anelCidadan/ablaDa? nielTablaDa=3&eidicidadTablaDa=anal&indicadTablaDa=772&accinReg
9/43
/
10/3
/
11/3
/
Acelai is a measurement of similarit between close observations of the same phenomenon.
Eample ith temporal atocorrelation: f ou measure our weight, two observations close in time are ver similar than distant ones.
Saial acelai is more nuanced because, unlike time, spatial variables are at least two-dimensional.
Spatial atocorrelation: Describe the etent to which two observations from neighboring regions ehibit higher correlation than distant ones.
12/43
/
Mai ble: if autocorrelation is not exploited in your model, your explanatoy variables coecients will display an unusual explanatory power, which might be the consequence of of just tting spatial noise.
n regression analysis, one of the standard assumptions is that errors are uncorrelated. Correlated errors suggest we have additional information in the data that has not been accounted for in the model as it is. n the case of spatial data, adjacent residuals tend to be similar and therefore atocorrelated. · · ·
13/43
/
14/43
/
1/43
/
Aig ha everything else de aec water capacity hi de hd be dece.
16/43
/
We ae ig hi B i eali, e hae hi:
Or coecient estimates ill be rong!
17/43
/
· Numerator measuring deviatiom from the mean for adjacent units. Denominator standardies the quantity to reect the variability of the quantity of interest. · ·
18/43
/
1/43
/
20/3
/
: $ : + 1: 601 = 0.21246, = 597, - = 0.006656 :
21/3
/
Kell, Mgan, The Sandard Errors of Persisence (Jne 3, 2019) (h://ae.n.cm/l3/ae.cfm? abac_id=3398303)
22/43
/
23/43
/
Thee model are idel ed in Ecolog, Economic and Epidemiolog. CAR a r deeloped b Jlian Beag in hi no claic 1974 paper Spaial neacion and he Saiical Anali of Laice Sem. · · ·
24/43
/
Single aggregated measure per spatial unit, it can be continuous, binar or discrete count. · Finite set of non-overlapping spatial units. For spatial units, the relationship is dened in terms of adjacenc. · ·
25/43
/
A neighbor relationship is dened as where . This relationship is smmetric (i.e if ) but not reeive (i.e. a region cannot be neighbor of itself).
26/43
/
1) Adjacenc matri , dening neighbor relationship.
There are two matrices describing dierent measures of adjacenc in this model.
27/43
/
1) Diagonal matrix , dening number
There are two matrices describing dierent measures of adjacenc in this model.
28/43
/
Saial ineacion beeen aeal ni i modelled cdiia a a nomall diibed andom aiable, eeened b he
(i.e. ). Theefoe, he condiional diibion of EACH i dened a follo, hee i he eighed ale of he neighbo. Fom Banejee, Calin, and Gelfand, 2004, ec. 3.2, i follo ha he join diibion
29/43
/
Recap! : between 0 and 1, it represents the strength of the spatial association, with 0 meaning spatial independence. D is our diagonal matrix. W is the adjacenc matrix. · · ·
30/43
/
31/43
/
The dieence beeen CAR and CAR i ha he aamee i e o 1. Hoee, eing ceae a challenge becae become a ingla mai (i.e. non-ineible). Thankfll, inclding he conain
= 1 D i o diagonal mai. W i he adjacenc mai. · · ·
32/43
/
CAR ce e deed a f, ad afe e ageba, e g bab de bece:
33/43
/
San i an open-orce probabiliic programming langage. ' rien in C++ and and genrall peaking, i i ed o pecif Baeian aiical model. San eimae parameer b calclaing he lg babili dei. (Tr mlipling a large nmber
qickl rn ino nmerical error.)
/
// T '' 'N'.
N ;
; <=0> ;
// ''. (, );
/
<=0> K; // <=0> N; <=1, =N> 1N; // 1 2 <=1, =N> 2N; // 1 < 2 <=0> N; // N,K X; // <=0>N E; //
/
( , N, 1, 2)
K ; // <=0> ; // N ; //
/
(E + 0 + X * + * ); 0 (0,2); ( 1:K) (0.0, 1.0); (0.0, 1.0); (N, 1, 2); // -- () (0, 0.001 * N);
/
a) Model with onl water capacit as a covariate. b) Model with water capacit and population densit as covariates d) Model with water capacit, pop densit and an CAR component (Stan)
39/43
/
40/43
/
B, J. (1974), Spatial nteraction and the Statistical Analsis of Lattice Sstems, J
S S, V. 36, N. 2. (://...//11/BS. (://.../%7E/11/BS.))
M, S; S, D (2019), Baesian Hierarchical Spatial Models: mplementing the Besag York Molli Model in Stan, S S- E, V 31, (://../10.17632/54.2 (://../10.17632/54.2)) M, M, Spatial Models in Stan: ntrinsic Auto-Regressie Models for Areal Data, (://-.///-/. (://-.///-/.)) B, J, C K.(1995) On conditional and intrinsic autoregression., B. · · · ·
41/43
/
Saial Daa Science ih R (h://aial.og/ae/inde.hml) CARBae (h://can.-
(h://can.-ojec.og/eb/ackage/de/inde.hml) (h://-aial.gihb.io/f/aicle/f1.hml) · · · ·
42/43
/
Mitzi Morris - Stan Evan Tachovsky - The Rockefeller Foundation Jim Savage - Schmidt Futures · · ·
43/43