SLIDE 16
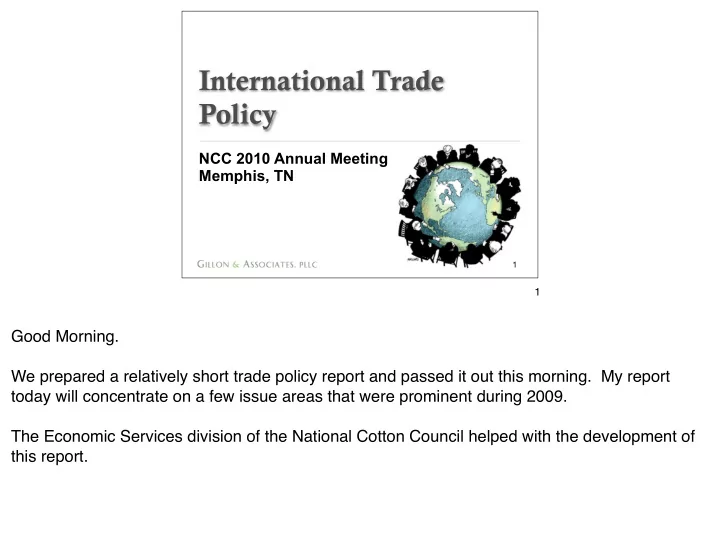
3,750 7,500 11,250 15,000 2005 2006 2007 2008
US China India Brazil
U.S. Upland Production 2004 as Base India, China, Brazil Cotton Production - 2004 as Base
Marketing Year (Aug-July) (bales)
16
This chart just shows more of the same, using a difgerent base year. For every one bale that US production declined in 2008 as compared to 2005, Brazil, China and India combined increased their production by 2.4 bales. Using difgerent years results in difgerent ratios, but every year since 2005 shows the same basic result -- the US has become less of a factor on world markets, but prices have not strengthened. Instead, China, Brazil and India have stepped in to fill the gap. Brazil's claimed injury from U.S. cotton subsidies flies in the face of its increased cotton production concurrent with dramatic U.S. production declines. The U.S. cotton program cannot be proven to be suppressing world cotton prices when every bale by which the U.S. decreases production is replaced by a bale produced by India
- r China or Brazil, regardless of the movement of world prices. The U.S. is one of the only major cotton
producing countries that has significantly decreased cotton acreage in response to soft world prices.
16