
SLIDE 1
27 February 2008 27 February 2008
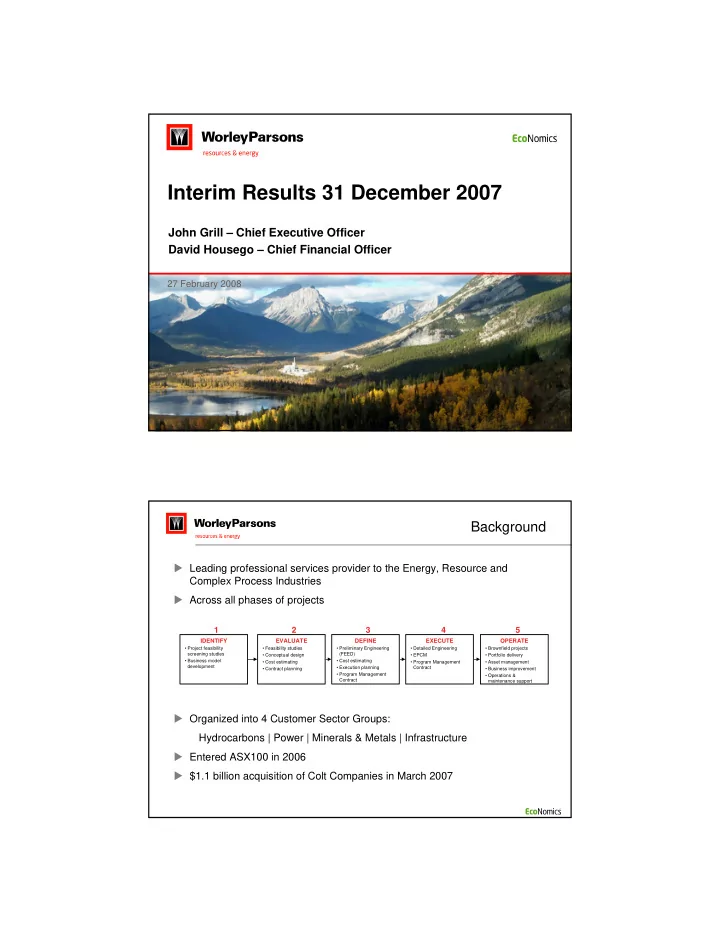
Interim Results 31 December 2007
John Grill – Chief Executive Officer David Housego – Chief Financial Officer
Leading professional services provider to the Energy, Resource and Complex Process Industries Across all phases of projects Organized into 4 Customer Sector Groups: Hydrocarbons | Power | Minerals & Metals | Infrastructure Entered ASX100 in 2006 $1.1 billion acquisition of Colt Companies in March 2007
Background
IDENTIFY
- Project feasibility
screening studies
- Business model
development
EVALUATE
- Feasibility studies
- Conceptual design
- Cost estimating
- Contract planning
DEFINE
- Preliminary Engineering
(FEED)
- Cost estimating
- Execution planning
- Program Management
Contract
EXECUTE
- Detailed Engineering
- EPCM
- Program Management
Contract
OPERATE
- Brownfield projects
- Portfolio delivery
- Asset management
- Business improvement
- Operations &
maintenance support
1 2 3 4 5