
SLIDE 1
18 October 2011 IR&DM, WS'11/12
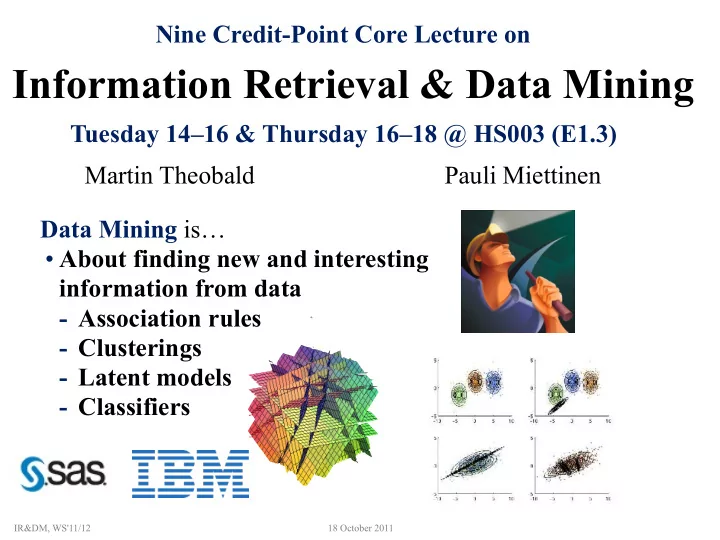
Data Mining is…
- About finding new and interesting
information from data
- Association rules
- Clusterings
- Latent models
- Classifiers