
SLIDE 1
5/1/2017 1
Inferential Statistics
IMGD 2905
Chapters 6 &7
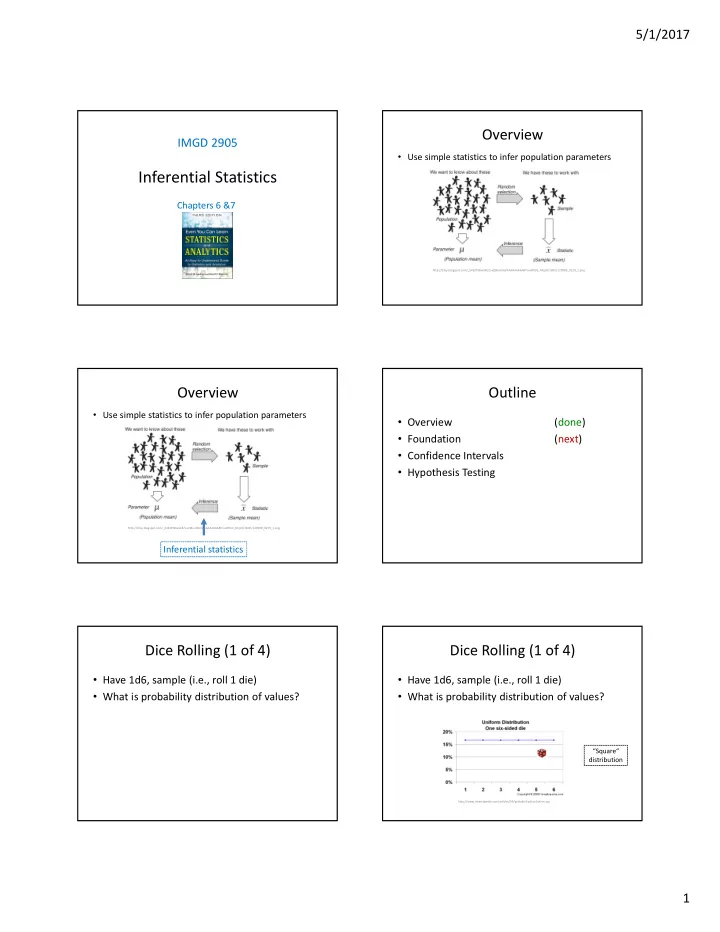
Overview
- Use simple statistics to infer population parameters
http://3.bp.blogspot.com/_94E2PdKwaXE/S-xQRuoiKAI/AAAAAAAAABY/xvDRcG_Mcj0/s1600/120909_0159_1.png
Overview
- Use simple statistics to infer population parameters
Inferential statistics
http://3.bp.blogspot.com/_94E2PdKwaXE/S-xQRuoiKAI/AAAAAAAAABY/xvDRcG_Mcj0/s1600/120909_0159_1.png
Outline
- Overview
(done)
- Foundation
(next)
- Confidence Intervals
- Hypothesis Testing
Dice Rolling (1 of 4)
- Have 1d6, sample (i.e., roll 1 die)
- What is probability distribution of values?
Dice Rolling (1 of 4)
- Have 1d6, sample (i.e., roll 1 die)
- What is probability distribution of values?
http://www.investopedia.com/articles/06/probabilitydistribution.asp
“Square“ distribution