
SLIDE 1
9/5/2015 1
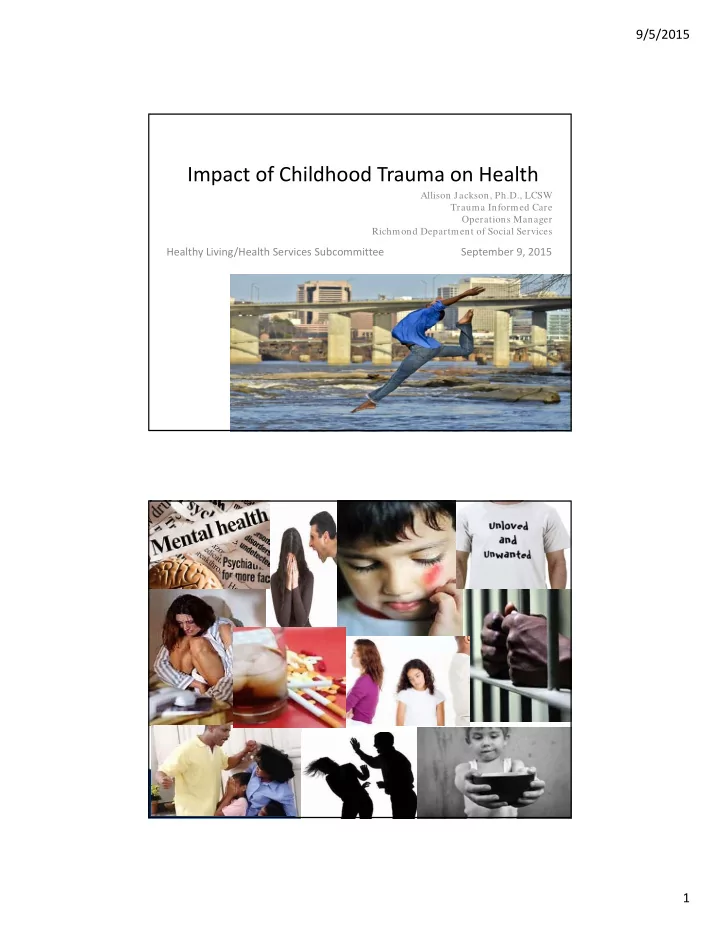
Impact of Childhood Trauma on Health
Allison Jackson, Ph.D., LCSW Trauma Informed Care Operations Manager Richmond Department of Social Services
Healthy Living/Health Services Subcommittee September 9, 2015
2
Impact of Childhood Trauma on Health Allison Jackson, Ph.D., LCSW - - PDF document
9/5/2015 Impact of Childhood Trauma on Health Allison Jackson, Ph.D., LCSW Trauma Informed Care Operations Manager Richmond Department of Social Services Healthy Living/Health Services Subcommittee September 9, 2015 2 1 9/5/2015 3 Brains
Allison Jackson, Ph.D., LCSW Trauma Informed Care Operations Manager Richmond Department of Social Services
Healthy Living/Health Services Subcommittee September 9, 2015
2
3
4
A large portion of many health, safety and prosperity conditions is attributable to Adverse Childhood Experience. ACE reduction reliably predicts a decrease in all
these conditions simultaneously.
5
NEUTRAL START
OUTCOME Individual & species survive the worst conditions. INDIVIDUAL
brains”
TRAUMATIC STRESS
OUTCOME Individual & species live peacefully in good times; vulnerable in poor conditions INDIVIDUAL
through
power” BRAIN Hormones, chemicals & cellular systems prepare for a tough life in an evil world BRAIN Hormones, chemicals & cellular systems prepare for life in a benevolent world
6
7
8
ACE REDUCTION IS A WINNABLE ISSUE
9.8% 23.6% 31.8% 35.2% 38.4% 15.1% 25.9% 33.8% 37.9% 29.6% 65+ 55-64 45-54 35-44 18-34 In Crisis & Persistent Thriving
Low capacity
Youngest Age Cohort
(n=1,537,995) (n=1,255,900)
HIGH CAPACITY COMMUNITIES REDUCE PERCENT OF YOUNG ADULTS WITH ≥ 3 ACEs
10874 3727 1264 3845 1065 1004 2828 2128 5767 1888 Smoking Binge Drinking HIV Mental Illness (MI) Missed work due to MI Heart Disease Cancer Asthma Limited Activity (due to disability) Lack of Social Support
POSITIVE ACE TREND MEANS REDUCED CASES:
High capacity
9
10
11
12