
SLIDE 1
INDIVIDUAL INCOME TAX
(CONSENSUS FORECASTING GROUP)
THOMAS JONES, PH.D. DECEMBER 4, 2020
Office of State Budget Director
IIT Receipts History
($ millions)
2
IIT % chg FY18 4,603.6 4.8 FY19 4,544.7
- 1.3
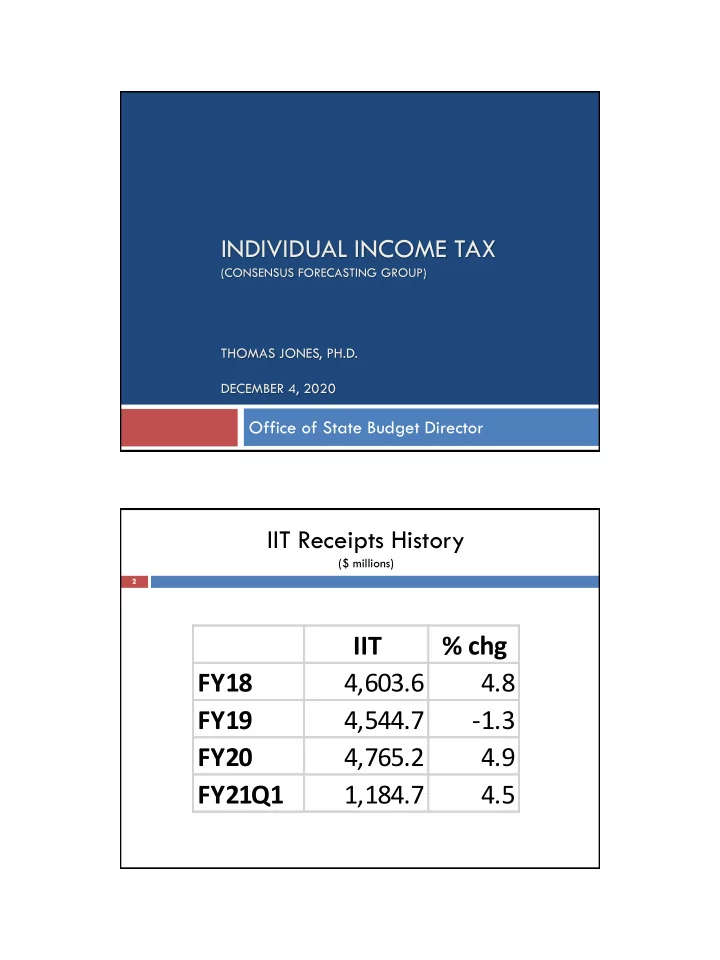
IIT % chg FY18 4,603.6 4.8 FY19 4,544.7 -1.3 FY20 4,765.2 - - PDF document
INDIVIDUAL INCOME TAX (CONSENSUS FORECASTING GROUP) THOMAS JONES, PH.D. DECEMBER 4, 2020 Office of State Budget Director IIT Receipts History ($ millions) 2 IIT % chg FY18 4,603.6 4.8 FY19 4,544.7 -1.3 FY20 4,765.2 4.9 FY21Q1
(CONSENSUS FORECASTING GROUP)
($ millions)
2
3
($ millions)
4
($ millions)
5
($ millions)
6
($ millions)
7
($ millions)
8
FY21 Est. Growth
prior year (%) Oct-20 Oct-19 Current YTD Prior YTD Actual Growth
prior year (%) Amount Needed during rest of year Growth Needed rest of year (%) IIT - Off. Est. 4,770.9 0.1 385.6 368.5 1,570.3 1,502.4 4.5 3,200.6
IIT - CON 4,818.0 1.1 385.6 368.5 1,570.3 1,502.4 4.5 3,247.7
IIT - PES 4,790.3 0.5 385.6 368.5 1,570.3 1,502.4 4.5 3,220.0
IIT - OPT 4,837.0 1.5 385.6 368.5 1,570.3 1,502.4 4.5 3,266.7 0.1
(CONSENSUS FORECASTING GROUP)
10
11
12
($ millions)
13
($ millions)
14
FY21 Est. Growth
prior year (%) Oct-20 Oct-19 Current YTD Prior YTD Actual Growth
prior year (%) Amount Needed during rest of year Growth Needed rest of year (%) Coal - Off. Est. 44.6
4.6 5.1 16.7 22.7
27.8
Coal - CON 35.9
4.6 5.1 16.7 22.7
19.2
Coal - PES 35.2
4.6 5.1 16.7 22.7
18.5
Coal - OPT 36.7
4.6 5.1 16.7 22.7
20.0
FY20 growth was 3.4% Qtr1 through Qtr 3 grew at 6.7% Qtr 4 fell by 5.9% The rebound in sales tax growth in FY21 has been robust FY21 July-October growth is 6.8% 12.3% growth in July 2020 may have been stimulus-related Since July, growth has been 3.9% in August, 4.5% in September, and
6.3% in October
Growth has remained positive despite the expiration of many
federal stimulus initiatives
Growing sectors outweigh the declining sectors
16
17
Percent Growth Nominal Growth ($ Millions) Online Sales 158.0% 18.4 $ Motor vehicle & parts 29.0% 0.1 $ Building material, hardware, garden center 17.0% 3.8 $ General Merchandise (Big box) 14.5% 3.2 $ Sporting Goods, Hobby, Book Stores 14.5% 0.8 $ Grocery and Beverage 5.0% 0.8 $ Specialty Trade Contractors 4.0% 0.2 $ Electronics & Appliances 1.0% 0.1 $
Percent Growth Nominal Growth ($ Millions) Movies/Theatres
(0.5) $ Personal & Laundry Services
(5.3) $ Performing Arts/Spectator Sports
(0.4) $ Hotels & Other Accommodations
(3.7) $ Machinery Manufacturing
(0.4) $ Amusement, Gambling & Recreation
(0.3) $ Restaurants & Bars
(2.8) $ Clothing & Clothing Accessories
(0.7) $ Utilities
(1.1) $ Repair & Maintenance
(0.2) $ Miscellaneous Store Retailers
(0.9) $
18
8.2 9.0 7.9 11.5 7.8 4.9 7.6
7.0
0.0 2.0 4.0 6.0 8.0 10.0 12.0 14.0 1st Quarter 2nd Quarter 3rd Quarter 4th Quarter FY 19 FY20 FY21 19
Turning points are difficult! YTD in FY21 growth is 6.8% through October Re-ran the quarterly structural models and VAR model Rather than using a policy neutral sales tax dependent variable, tried to
implement dummy variables for tax reform and COVID19
US State and Local Personal Taxes, Consumer spending – Durables, Non-
durables, U.S. Retail sales, Kentucky wages and salaries, Kentucky personal income
VAR has seasonally adjusted sales tax and KY personal income as dependent
variables, US State and Local Personal Taxes as exogenous variable
All structural models used differenced data due to nonstationarity 20
(Billions of Dollars, Annual Rate, BEA)
$200 $250 $300 $350 $400 $450 $500 $550 $600 FY06 FY07 FY08 FY09 FY10 FY11 FY12 FY13 FY14 FY15 FY16 FY17 FY18 FY19 FY20 FY21 FY 22
Optimistic Pessimistic Control
21
(Billions of Dollars, Annual Rate, BEA)
$100 $120 $140 $160 $180 $200 $220 $240 $260 FY06 FY07 FY08 FY09 FY10 FY11 FY12 FY13 FY14 FY15 FY16 FY17 FY18 FY19 FY20 FY21 FY 22
Optimistic Pessimistic Control
22
(Billions of Dollars, Annual Rate, BEA)
$100 $150 $200 $250 $300 $350 $400 $450 FY06 FY07 FY08 FY09 FY10 FY11 FY12 FY13 FY14 FY15 FY16 FY17 FY18 FY19 FY20 FY21 FY 22
Optimistic Pessimistic Control
23
(Billions of Dollars, Annual Rate, IHS Markit Economics)
$100 $300 $500 $700 $900 $1,100 $1,300 $1,500 FY06 FY07 FY08 FY09 FY10 FY11 FY12 FY13 FY14 FY15 FY16 FY17 FY18 FY19 FY20 FY21 FY 22
Optimistic Pessimistic Control
24
(Billions of Dollars, Annual Rate, Census)
$3,500 $4,000 $4,500 $5,000 $5,500 $6,000 $6,500 $7,000 $7,500 FY06 FY07 FY08 FY09 FY10 FY11 FY12 FY13 FY14 FY15 FY16 FY17 FY18 FY19 FY20 FY21 FY 22
Optimistic Pessimistic Control
25
FY 21 FY 22
26
FY 21 FY 22
27
(3.4% growth)
(4.0% growth)
(2.7% growth)
(3.4% growth)
(5.2% growth)
(3.1% growth)
(3.4% growth)
(2.0% growth)
(1.5% growth)
28
(2.8% growth)
(2.7% growth)
(4.3% growth)
(3.1% growth)
(0.3% growth)
(1.5% growth)
29
(CONSENSUS FORECASTING GROUP)
FY20 FY21 Q1-Q3 Q4 Total July - Oct Corp & LLET
31
32
11.3% 12.5% 4.3% 11.5%
1.9% 0.8% 1.8%
0.0% 5.0% 10.0% 15.0% $0.0 $100.0 $200.0 $300.0 $400.0 $500.0 $600.0 $700.0 $800.0 $900.0 FY12 FY13 FY14 FY15 FY16 FY17 FY18 FY19 FY20
33
Billions $
$1,000.0 $1,200.0 $1,400.0 $1,600.0 $1,800.0 $2,000.0 $2,200.0 $2,400.0 $2,600.0 $2,800.0 $3,000.0
Control Optimistic Pessimistic
34
FY20 FY21 FY22 Actual %Chg Estimate %Chg Estimate %Chg Control 639.2
567.5
589.6 3.9 Optimistic 639.2
574.6
621.3 8.1 Pessimistic 639.2
548.6
554.7 1.1
35
Estimate July - Oct $ Needs % Needs Control $567.5 $206.1 $361.4
Optimistic 574.6 206.1 368.5
Pessimistic 548.6 206.1 342.5
36
(CONSENSUS FORECASTING GROUP)
FY20 FY21 Q1-Q3 Q4 Total July - Oct Real 3.6
3.5
Tangible 5.4
3.6 632.6 Motor Vehicle 3.8
17.0 Omitted & Delinquent
NA
26.6 Public Service 9.4
0.6 14.8 Total 3.5
35.8
38
FY20 FY21 FY22 Actual % Chg Estimate % Chg Estimate % Chg Control $643.0
$663.7 3.2 $681.7 2.7 Optimistic 643.0
672.9 4.7 693.6 3.1 Pessimistic 643.0
651.4 1.3 664.3 2.0
39
Residential, commercial and farm property assessed
Tax rate for 2020 unchanged at 12.2 cents per
Assessments growth gradually increasing over the
New property lower than in 2019 Increased delinquencies
40
FY20 FY21 FY22 Actual % Chg Estimate % Chg Estimate % Chg Control $304.0 3.5 $313.4 3.1 $323.8 3.3 Optimistic 304.0 3.5 314.6 3.5 326.6 3.8 Pessimistic 304.0 3.5 312.2 2.7 318.7 2.1
41
Self-assessed property with rates ranging from 0.1
Business & telecom property, apportioned vehicles
DOR seeing lower reported assessed values due to
If new assessments denied, omitted collections will
42
FY20 FY21 FY22 Actual % Chg Estimate % Chg Estimate % Chg Control $113.2 3.6 $110.5
$111.5 0.9 Optimistic 113.2 3.6 112.3
114.1 1.6 Pessimistic 113.2 3.6 105.7
107.6 1.8
43
Collections fell in FY20 due to COVID restrictions as
Taxpayers were given extensions to pay but could
Receipts from FY20 have been received in FY21.
Surge in motor vehicle sales
44
FY20 FY21 FY22 Actual % Chg Estimate % Chg Estimate % Chg Control $134.3
$152.2 13.3 $159.0 4.5 Optimistic 134.3
155.8 16.0 163.4 4.9 Pessimistic 134.3
150.7 12.2 155.2 3.0
45
Collections were down in FY20 because of
Work flow and compliance initiatives
46
FY20 FY21 FY22 Actual % Chg Estimate % Chg Estimate % Chg Control $12.2
$12.0
$13.0 8.3 Optimistic 12.2
13.5 10.7 13.5 0.0 Pessimistic 12.2
10.0
10.0 0.0
47
Gas, water and electric utilities, railroads,
Reduction due largely to airlines which have
Lower valuation for airlines
48
FY20 FY21 FY22 Actual % Chg Estimate % Chg Estimate % Chg Control 71.4 0.6 68.5
68.5 0.0 Optimistic 71.4 0.6 69.5
70.0 0.7 Pessimistic 71.4 0.6 67.2
67.2 0.0
49
FY20 FY21 FY22 Actual % Chg Estimate % Chg Estimate % Chg Control $2.2 7.8 $2.1
$2.1 0.0 Optimistic 2.2 7.8 2.2 0.0 2.2 0.0 Pessimistic 2.2 7.8 1.8
1.8 0.0
50
FY20 FY21 FY22 Actual % Chg Estimate % Chg Estimate % Chg Control $643.0
$663.7 3.2 $681.7 2.7 Optimistic 643.0
672.9 4.7 693.6 3.1 Pessimistic 643.0
651.4 1.3 664.3 2.0
51
FY20 cigarette tax was 0.4% higher than FY19 on a tax rate-
Year-to-date (through October) cigarette tax in FY21: -3.2% Discounting is beginning to abate, counter prices rising Seeing some movement down the product line Kentucky is beginning to see consumption declines, but not as
COVID cuts both ways for cigarettes: Lower disposable income, fewer exports due to lower travel COVID lockdown stress drives up sticks per day
53
(0.4% growth)
(-2.8% growth)
(-2.8% growth)
(0.4% growth)
(-1.5% growth)
(-1.8% growth)
(0.4% growth)
(-3.5% growth)
(-3.0% growth)
54
FY21 Notes:
Strong sales in FY2021 through October build on a strong close in FY2020, where KLC
ended the year with record total sales of $1.2 billion, an increase of 6.5% from the previous year.
Scratch-off tickets are the largest individual game category. Through the first four months
The iLottery channel sales increased significantly in response to COVID-19 during the
fourth quarter of FY20. Growth has continued in FY21with sales exceeding expectations.
Draw game sales are also trending ahead of expectations, despite a lack of large
Powerball and Mega Millions jackpots.
FY 22 Notes:
Additional growth is expected in FY2022 as result of a full year of additional lottery
vending machines, which largely supports the scratch-off products.
Planned game and platform enhancements should lead to additional iLottery channel sales
growth.
56
(Fiscal Years, Millions $)
$215.3 $219.5 $221.5 $241.8 $241.6 $253.0 $263.9 $271.4 $286.1 $292.0 $150.0 $170.0 $190.0 $210.0 $230.0 $250.0 $270.0 $290.0 $310.0 2013 2014 2015 2016 2017 2018 2019 2020 2021 2022 57
(Millions S)
$700.2 $690.1 $703.7 $790.4 $763.1 $763.3 $665.3 $500.0 $550.0 $600.0 $650.0 $700.0 $750.0 $800.0 $850.0 2016 2017 2018 2019 2020 2021 2022 59
(Million of Dollars) FY20 FY21 FY22 Actual Estimate Estimate Insurance premium taxes 168.8 170.9 172.3 Bank franchise taxes 123.1 124.0 0.25 Abandoned Property 43.8 32.5 35.0 Alcohol Taxes 158.8 165.7 171.4 Telecommunication taxes 68.1 75.6 77.8 Inheritance taxes 46.3 48.5 49.0 Other Tobacco Products 21.3 30.0 36.0
60
Natural Gas Severance Oil Production Tax Court Costs TVA – In Lieu of Taxes - State Portion Abandoned Property License Taxes
61
(-3.5% growth)
(0.1% growth)
(-12.8% growth)
(-3.5% growth)
(1.2% growth)
(-12.2% growth)
(-3.5% growth)
(-1.1% growth)
(-13.8% growth)
62