
SLIDE 1
Identifying Heat Transfer Regimes by Acoustic Analysis in Pool and Flow Boiling
Do Yeong Lim, Ji Yong Kim, Dong Hun Lee, Kyung Mo Kim, In Cheol Bang* Department of Nuclear Engineering, Ulsan National Institute of Science and Technology (UNIST) 50 UNIST-gill, Ulju-gun, Ulsan, 44919, Republic of Korea
*Corresponding author: icbang@unist.ac.kr
- 1. Introduction
Ensuring the integrity of fuel rods during the
- peration and design basis accident (DBA) in the
nuclear power plant (NPP) is major concerning issues to maintain the heat transfer and prevent the fission product release. when compared to boiling heat transfer and liquid single-phase heat transfer, a critical heat flux (CHF) or a departure from nucleate boiling (DNB) as known as a thermal margin of NPPs results in a low heat transfer coefficient due to the formation of a vapor film insulator on the fuel rods [1]. Thereby, CHF leads fuel rods to a sudden rise in temperature and cracking and
- melting. To prevent the thermal damage in fuel rods, the
CHF prediction in NPPs has been conservatively derived from the experimental correlation using the parameter related to flow regimes and boiling phenomena such as temperature, pressure, and flow rate and, etc. However, this conservative approach is not an effective reactor design because it secures an excessive thermal margin. And there is a limitation that conventional diagnosis technologies such as thermocouples, flowmeters, and pressure gauges have a relatively long response time to the physical changes as shown in Table 1 so that these could not provide direct physical information to identify the flow and boiling phenomena [2]. For the improved safety and efficiency in NPPs, monitoring and identifying the physical parameters of the flow regime and boiling regime are essential. To do so, Acoustic analysis, a non-destructive diagnostic technology, is a promising method to measure the condition of an inaccessible system. Acoustics detects the acoustic emission (AE) signals from the system undergoing irreversible elastic changes, such as crack formation [3]. This technology looks forward to allows the real-time measurement of the flow and boiling information of the reactor system as well as the prediction of CHF. There were fundamental studies of AE signal measurement of the boiling experiment to the identification of flow and boiling regimes [4-6]. Seo and Bang [4] conducted a quenching experiment with the frequency power spectrum analysis of boiling AE
- signals. They reported that each boiling regime had
distinguishable AE frequency peaks, and the bubble collision and collapse showed a relatively higher AE frequency than the bubble growth. Under the pool boiling conditions, Sinha et al. [5] experimented and developed a frequency-based real-time power cut-off
Table 1: Response time of diagnosis technologies [2] Parameter Instrument TResponse (s) Structure T Thermocouple 1.0~3.0 Analog P
- Pres. gauge
1.0~2.0 Analog Q Flowmeter 0.05~2.5 Analog AE AE sensor < 0.001 Digital
system when CHF occurs. Alssayh et al. [6] showed that statistical method-applied AE analysis successfully classified the two-phase flow regimes. In this study, to identify both flow and boiling regimes inside the system non-destructively, a pool boiling experiment with measuring AE signals was conducted under atmospheric pressure using deionized water as a first step. At the same moment, visualized images were captured by a high-speed video (HSV) and Infrared (IR) thermometry. To classify boiling regimes, boiling heat transfer characteristics were analyzed based
- n AE signals features while compared with the
visualized images. Then, the flow boiling experiment with measuring AE signals were designed to compare the AE data characteristics from pool boiling phenomena under low quality and subcooled condition.
- 2. Experiment
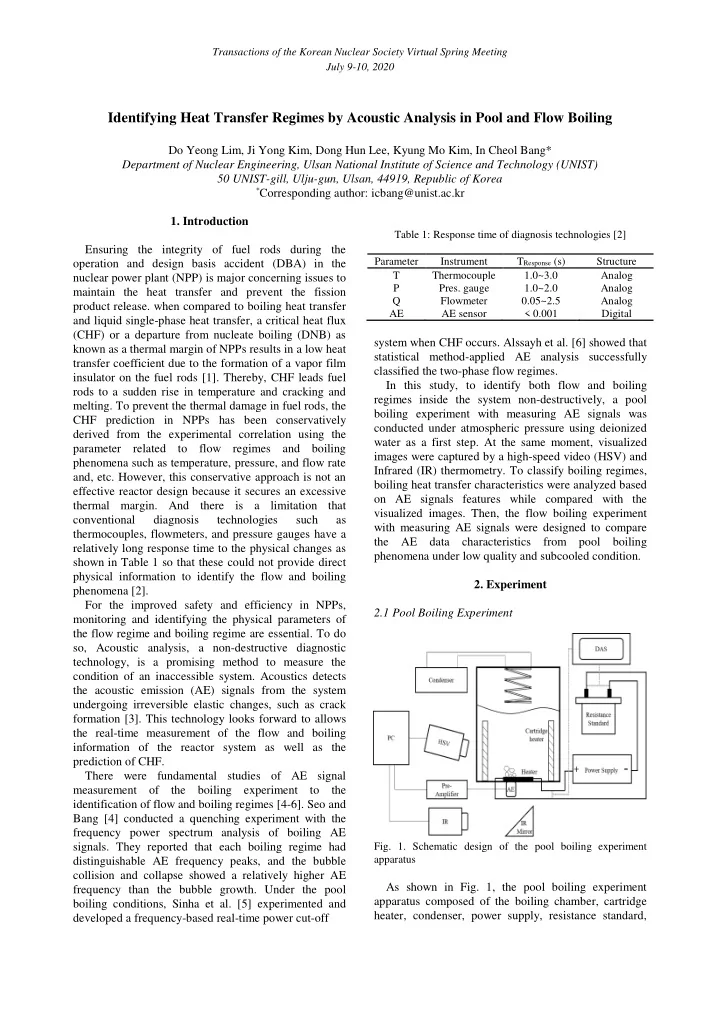
2.1 Pool Boiling Experiment
- Fig. 1. Schematic design of the pool boiling experiment