Ian Cockerill Thanks very much Willie. Morning everybody. You can - - PDF document

ian cockerill
SMART_READER_LITE
LIVE PREVIEW

Ian Cockerill Thanks very much Willie. Morning everybody. You can - - PDF document

Introduction Willie Jacobsz - Good morning ladies and gentlemen. Welcome to the Q2 quarterly results for Gold Fields Ltd. I just want to assure you that weve learnt a lot about power outages in the last few days and we do have stand-by


slide-1
SLIDE 1

Back To Work Back To Work

Q2 F2008 Results 31 January 2008

Introduction – Willie Jacobsz - Good morning ladies and gentlemen. Welcome to the Q2 quarterly results for Gold Fields Ltd. I just want to assure you that we’ve learnt a lot about power outages in the last few days and we do have stand-by generators and UPSs and so on, so we hopefully won’t be without power. May I ask you all to just switch off your cell phones please? We would also like to particularly welcome the people who are watching the presentation on DSTV and those on the website. The procedure we will follow is that Ian will kick off and people will then speak in the order that they’re sitting here, and then afterwards there will be time for questions. After the presentation and the Q&A time we will be serving some food, but it’s out that door this time and not this one. And we will have a press media interview in one of the rooms behind us immediately after the

  • presentations. Good. We hand over to Ian now.

Ian Cockerill

4

Introduction Introduction

Thanks very much Willie. Morning everybody. You can see the title of our presentation today is “Back to Work” and back to work we are, albeit somewhat slowly and somewhat

  • patchily. But I always think in times like this its quite important to have at least some

sense of humour., It is a serious subject, but having said that it is nice to show you that Gold Fields is trying to do something. I think also on another highlight point, it is quite pleasing for us as the headline sponsors of the Ghanaian Black Star soccer team to see them getting through to the knockout stages of the African Cup of Nations. And probably the one highlight this last week that I’ve had is that last night Liverpool got beaten by West Ham and is now four places below Everton. So at least there have been some good points for this particular week.

5

Introduction Introduction Highlights Highlights

Gold Price Captured in Margin Growth Gold Price Captured in Margin Growth

Just looking at the quarter as a whole, actually the quarter under review was… we gave the guidance in early December on where we were going to be on production, but it was pleasing to see that our net earnings are up quite significantly to just below R2 billion. If you strip out all the funnies, the unrealised gains, if you look at the forex gains and losses, even on a bottom-line earnings basis it is still up nearly half to over R600 million. Obviously we’re starting to see the higher price translate through into stronger operating margins across the group, which I know has always been a major concern for everyone. Investors want to see this higher price coming through into the margin, and we’re consistently seeing that now. Production was down 3% to 960,000 ounces, bearing in mind this is comparing quarter on quarter without Choco either in this quarter or the previous quarter. But despite the production being down slightly, unit cash costs were

  • nly up 3% to just over R101,000 per kilogram. And I think it shows the degree of cost

control that we are trying to bring to this business. Now normally we would be paying a dividend in this quarter, but it was decided by the board last night, solely on the basis of the current power crisis, it was deemed prudent not to pay a dividend in this quarter. But it’s basically because of the power situation, and let’s see what eventuates.

6

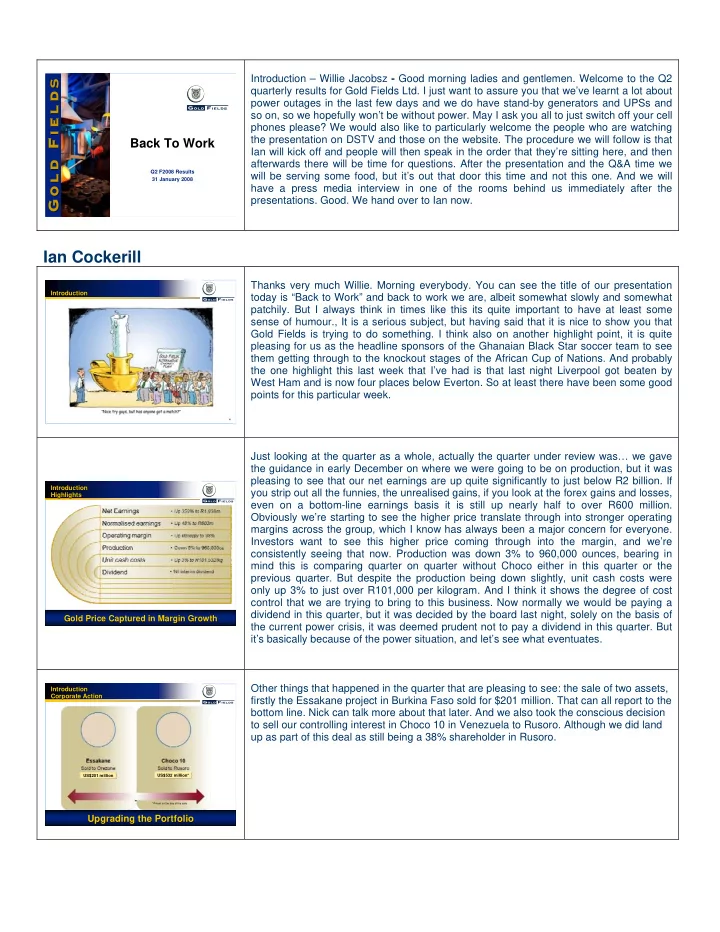
Introduction Introduction Corporate Action Corporate Action

Upgrading the Portfolio Upgrading the Portfolio

* Priced on the day of the sale

US$201 million US$532 million*

Other things that happened in the quarter that are pleasing to see: the sale of two assets, firstly the Essakane project in Burkina Faso sold for $201 million. That can all report to the bottom line. Nick can talk more about that later. And we also took the conscious decision to sell our controlling interest in Choco 10 in Venezuela to Rusoro. Although we did land up as part of this deal as still being a 38% shareholder in Rusoro.

slide-2
SLIDE 2

7

Introduction Introduction Cerro Corona Project Cerro Corona Project

LOM Salient Features LOM Salient Features Ore 6.2mtpa Au 150koz Cu 57mlb Cu (26kt) Au equiv* 360koz pa* Strip ratio 0.58 X Cash costs ~ US$320/oz Capital US$421m

EBITDA contribution* = (0.15*900 + 57*3.3) EBITDA contribution* = (0.15*900 + 57*3.3) – – (120) = ~US$203mpa (120) = ~US$203mpa

* Au equiv and EBITDA calc : US$900/oz Au and US$3.3lb and typical LOM parameters

But we’re out of Venezuela as an operating entity. I think the other important feature that certainly has occurred over the quarter is that towards the end of the December quarter the slippage that we had seen in the Cerro Corona project has started to reverse. John will give you a lot more detail later on, but it is pleasing to see the recovery in the situation

  • there. And the situation is looking a lot healthier than it did a couple of months back, so

we are very pleased. And John can give you more details.

8

Introduction Introduction Consequences of Power Shedding Consequences of Power Shedding

South African Mines Back At Work South African Mines Back At Work

  • 10% energy saving imposed by Eskom

̵

Energy efficiencies across all mines

̵

Potential shedding of marginal production

  • 10% energy saving imposed by Eskom

̵

Energy efficiencies across all mines

̵

Potential shedding of marginal production

  • Reviewing power constrained options for South Deep
  • Reviewing power constrained options for South Deep
  • Q3 08 Production: down 20% to 25%

̵

Christmas break

̵

Power shedding

  • Q3 08 Production: down 20% to 25%

̵

Christmas break

̵

Power shedding

  • Steady state production at 90% power: down 15% to 20%
  • Steady state production at 90% power: down 15% to 20%

Now clearly the one issue which is paramount in everybody’s minds is what are the consequences of this situation in which we find ourselves here in South Africa? Well as things stand we have been told by Eskom that as of this evening they have said to us that they hope to put us back into a position where we will get 90% of our normal power

  • allocation. And if you look at that, the normal power allocation is somewhere in the order
  • f 600 megawatts of total power. So we’re going to be looking at a total power supply to
  • ur mines going forward hopefully of around 540 megawatts. Now clearly over the past

few years we’ve done an awful lot on energy efficiency and looking at more effective ways

  • f utilising our power, a lot of demand side programmes. So we’ve actually teased out a

lot of efficiency savings from our operations. But I think in a situation like this we clearly have got to see what else we can do, both short-term and long-term, to reduce the amount of power that we need to keep our mines running. Bear in mind, we require at least half of that 600 megawatt just to keep our mines in a steady state condition. And by that I mean literally emergency pumping, minimal ventilation and minimal refrigeration. There is no power allowance in there for running your compressors full tilt, hoisting or

  • milling. So effectively over 300 megawatts is required just to keep your mine alive. On top
  • f that mining takes an incremental amount.

So you take 10% power away from overall, it actually eats into 20% of your mining

  • capacity. So this is a serious issue. Clearly what we’ve got to do is look at how we

prioritise our power, and that’s the work that the guys have spent a lot of time on over the last week, seeing how we can do that. Obviously when it comes to power constraints everything has to be looked at. Even something like South Deep, a critical part of Gold Fields’ future, a very important part, and will continue to be an important part of Gold Fields’ future, even that has to be looked at as well. What is the impact on production here in South Africa? Well, it’s difficult to say at this stage, because we’re still building back up again. But the first part that we can see is the power outages we have had, the normal slow start-up after the Christmas break, all of those features are likely to mean that we will be down between 20% and 25% on South African production in the March

  • quarter. That’s just a guideline. I can’t give it to you any more accurately than that

because we don’t know how quickly we can build our production back up or how the power comes online. But I know that you’re going to ask that question. We tried to give you an effective range. However, on assuming a normal quarter, and assuming 90% of power, the best guess that we can come up with is that production from South Africa would be down – using the September quarter as a proxy – somewhere north of 15%. That should give you 15% to 20%. That will give you a ballpark number to think about. As things stand at the moment we are moving back. We have started to hoist at Driefontein as well as Beatrix. Beatrix is less affected, being a shallower mine, and can get moving a bit quicker. It’s a cooler mine than our deeper-level mines. Already we’re around 40% to 50% of normal hoisting, and we started to do some limited milling. But I must stress this is a very serious situation. We take it seriously. The guys on the

  • perations have done a fantastic job of analysing where we should be applying the scarce

power, and make sure that we’re maximising the returns that we get for that scarce

  • power. I think with that brief introduction let me hand you over to Nick.
slide-3
SLIDE 3

Nick Holland

1

Financial Financial Salient Features Salient Features

Q2F2008 Q2F2008 Q1F2008 Q1F2008 Gold produced – attributable 000oz 960 986 Exchange rate ZAR/US$ 6.76 7.10 Revenue US$/oz 784 680 R/kg 170,488 155,333 Rm 5,430 5,018 Operating costs Rm 3,341 3,292 R/ton 265 267 SA ug R/t 713 671 Operating profit Rm 2,037 1,716 Operating margin % 38 34 Total cash costs Total cash costs R/kg R/kg 101,532 101,532 98,456 98,456 US$ 467 431

1

Operating Margin Increased to 38% Operating Margin Increased to 38%

Thanks Ian, and good morning everybody. As you’ve heard from Ian our production for the quarter was down 3% to 960,000 ounces, but I think important to note is if you go back to last quarter we shows about one million ounces attributable and now we’re showing 986,000 for the comparative. And the reason for that is that we’ve taken the Venezuelan operations out of the previous quarter, and obviously they’re not in this quarter because they were sold during the quarter. And the ounces in both quarters, which is around about 15,000 ounces last quarter and about 16,000 attributable this quarter, that is reflected as discontinued operations. So I think you want to try and get back to the figures we published previously, that is the way to do it. That drop in production you have heard is mainly the South African operations, and Terrence will explain in more detail the reasons around that. Looking at the Rand per kilogram price achieved, you can see we have gone up appreciably about R15,000 per kilogram, and all

  • f that really is on the back of a $100 increase in the gold price up to $784, with the Rand

coming back marginally to R6.76. Of course as we stand today we’re somewhere around R113,000 a kilogram, so today was substantially higher than that. Fortunately the higher price resulted in an offset against the lower production and revenue was up R400 million to R5.4 billion. Operating costs were pleasingly only up 1.5% to R3.3 billion, and I’ll go through some more detail in a moment on that. And of course that is increased revenue line caused by the increased prices flowing through to the bottom line, and we have seen our operating profit up to R2 billion for the quarter and

  • ur margin up to 38%. I think important to note are the internal objectives we set for
  • urselves for our margin. What we really need to make sure that we can pay all of
  • perating costs, we can fund all of our capital expenditure, we can pay a dividend to

shareholders and we can retain some money for growth we really need to try and get a margin of around 40%. And you may even argue at current prices it should be a lot higher than that. But certainly looking at these numbers in front of you, we would have liked to have seen a margin around 40% and that’s going to be an objective of ours going

  • forward. We can achieve that through higher production obviously, that is the easiest way

to do it, but also with more stringent cost control. So cash costs then are up to R101,000 per kilogram, but up higher in dollar terms because of that appreciation of the Rand from R7.10 to R6.76.

11

Financial Financial Operating Costs (R Operating Costs (R’ ’m) (Q On Q) m) (Q On Q)

R3,292m R3,341m R60m (1.8%) R44m (1.3%) -R55m (1.7%) Operational cost increases

2500 2600 2700 2800 2900 3000 3100 3200 3300 3400 3500

Q1F2008 South African Operations International Operations Exchange Rate Translation Q2F2008

Good Cost Control Good Cost Control

If we look at the operating costs I mentioned they had gone up 1.5%. If you look at our local operations you’ve seen an increase of R16 million there. That is on the back of normal inflationary increases. We are seeing continued inflation coming through on our input costs. That is reflected in our stores costs. There are certain parallel adjustments that also are coming through on a gradual basis as terms of pay are changed. And in addition we are investing more on training and creating flexibility by opening up certain reef areas. But it’s only a 1.8% increase in South Africa, so I think a good performance by the chaps. Internationally you’re seeing a 1.3% increase. Mainly increased volumes at Tarkwa which translated to increased production but also higher costs at Damang as a consequence of diesel and higher costs with longer loading distances and getting deeper. Glen will go into more detail on that. Then we’ve got a marginal offset as a result of the translation effect of translating at a stronger Rand.

12

Financial Financial Income Statement Income Statement

Q2F2008 Q2F2008 Q1F2008 Q1F2008

Operating profit Rm 2,037 1,716 Amortisation & depreciation Rm (763) (771) Net operating profit Rm 1,274 945 Finance cost Rm (97) (107) (Loss)/gain on financial instruments Rm (188) 9 Exploration Rm (78) (85) Other Rm (10) (11) Profit before tax & exceptional items Rm 901 751 Exceptional items Rm 1,417 29 Mining & income tax Rm (419) (289) Income from sale of Venezuela (discontinued

  • perations)

Rm 119 (8) Net profit Rm 2,018 483 Net profit attributable to minority shareholders Rm 80 54 Net profit attributable to ordinary shareholders Net profit attributable to ordinary shareholders Rm Rm 1,938 1,938 429 429

Taking you down further through the income statement, if you can remember the R2 billion operating I spoke about earlier. Amortisation was probably square quarter on

  • quarter. There are changes in mining mix to offset some of the reductions we’ve seen at

some of the operations so that squares out. Financing costs are around R100 million a quarter, which is a very comfortable level of debt service for us. We are quite happy that we can service that going forward, so no problem there. And then a bit of an anomaly this

  • quarter. We have incurred a book mark to market loss of R167 million on a derivative

instrument that relates to the arrangements with Mvelphanda. If you can recall, we have an arrangement with them whereby if they exchanged their shares in our local assets for Gold Fields they would receive a minimum of 45 million shares in Gold Fields and a maximum of 55 million shares. Well we have to value that as a derivative in terms of IS39. And because the basis used is essentially a market-related basis, and with the share price having declined over the last quarter, that has resulted in a book loss of about R167

  • million. It’s very sensitive to changes in the share price, and as I say it’s a book loss. We

won’t know the final situation on that until the shares are issued. Effectively it’s a loss because the floor would have been triggered. In other words, if you do a straight

slide-4
SLIDE 4

calculation of value for value there would have been less shares issued. Because the floor kicks in it results in a loss when you put it through the Monte Carlo simulation. Looking further down, exceptional items is the other big one to look at. R1.4 billion for the

  • quarter. And almost all of that is because of the sale of Essakane. If you can recall we

sold Essakane for $201 million. Effectively we have written everything off that we expensed on that asset because it hadn’t reached feasibility stage until after the middle of the year. So effectively all of those proceeds flow through into profit. That is the bulk of those exceptional items. Income tax you can see has gone up, which you can expect with the higher profit that we are showing. And then discontinued operations, just to reiterate that the R119 million includes R74 million we have realised on the sale of the Venezuelan assets that we sold during the quarter. We effectively realised a price on those assets of $413 million, and that translated into a Rand profit of R74 million. And we also showed the profit that we earned during the quarter in that line. So that is an [unclear] requirement that we strip out all of those numbers and put it onto this line.

13

Financial Financial Income Statement Income Statement

Q2 2008 Q2 2008 Q1 2008 Q1 2008 Net profit attributable to ordinary shareholders Rm 1,938 429 (SA)cps 297 66 Net profit excluding gains and losses on foreign exchange, financial instruments, exceptional items and discontinued operations Rm 603 408 (SA)cps 93 62

So net profit then was R2 billion, and after minorities R1.9 billion, for the quarter. Up five times, but of course significantly distorted by those asset sales that I mentioned. I think the important thing to look at here, and particularly for the analysts, is the core business if you strip out all the losses and gains on these derivatives and discontinued operations

  • etc. the real business showed a 48% increase in earnings to R603 million for the quarter.

And that is what you’d expect if you looked at the operating profit and factored in the additional tax and flowed that through to the bottom line. So it is entirely consistent with the improved operating performance from the core business.

14

Financial Financial Cash Flow Statement Cash Flow Statement

Q2F2008 Q2F2008 Q1F2008 Q1F2008

Cash flow from operations Rm 1,148 985 Dividends Rm

  • (620)

Capital expenditure net Rm (2,474) (1,897) Disposals

  • Essakane
  • Venezuela

Rm Rm 1,042 1,193

  • (28)

Other investing activities Rm 17 (8) Net loans (repaid)/received Rm (1,081) 736 Other financing activities Rm 12 9 Net cash outflow Rm (143) (823) Currency translation adjustment Rm (6) (17) Cash at beginning of period Rm 1,470 2,310 Cash at end of period Rm 1,321 1,470

Looking at cash flow, the cash flow from operations for the quarter was up to R1.1 billion. You may well say why isn’t it more, given that a proxy for cash flow from operations would typically be your operating profit, which as you saw earlier was R2 billion. The simple reason there is that we have to take into account tax payments that get deducted from that item, whereas on the income statement it is shown below that. And also we have had fairly substantial working capital swings this quarter. We have reinvested almost R600 million into working capital, and that’s purely timing. And it is often that sales only get booked right at the end because of shipping and logistics. And then also over the December period salaries tend to be paid a lot earlier, and also with favourable discounts we get from creditors we tend to pay early. So you’ve got to bear in mind there is a R600 million to R700 million swing here that I would expect to reverse in the next quarter. So that does distort cash flow from operations. Working capital movements are difficult to predict of course. Capital expenditure was R2.5 billion for the quarter. That is as high as we’ve ever spent. Pretty high capital expenditure. And it does reflect the significant capital on Corona of about R680 million spent in Peru during the quarter and also the Tarkwa project. Both of those projects are slated to be completed at the half year and in the second half of the year respectively. So we are going to see high capital burn for at least another quarter, but I would expect in the second half of the year that is going to reduce. The disposals I have spoken about. If you look at the disposals in total we generated about $615 million

  • r about R4 billion. But bear in mind that those disposals were part cash and part shares

in the acquirer, and we realised $330 million or about R2.2 billion in cash. That is what you see coming through the income statement, and the balance of about R2 billion sits as investments on our balance sheet. That essentially provides a little bit of a kitty for us. A lot of that cash has been used to retire debt. We took a conscious decision to retire some

  • f the debt that we had built up, so about $260 million of that $330 million went into debt

reduction, and the balance when into funding some of these high-capital programmes that we presently have.

slide-5
SLIDE 5

15

Financial Financial How is the Business Doing? How is the Business Doing?

December Quarter December Quarter R R’ ’m m R/kg R/kg US$/oz US$/oz Revenue 5,430 170,488 784 Operating costs net (3,392) (106,515) (490) Operating profit 2,038 63,973 294 Finance costs (97) (2,895) (14) Exploration (79) (2,471) (11) Capex - sustaining (933) (29,295) (135) Taxes and royalties (410) (12,874) (59) Surplus from current operations 519 16,287 75 Long term growth and replacement capex (1,542) (48,417) (223) Cerro Corona (649) (20,378) (95) Uncle Harry’s (400) (12,560) (58) South Deep (204) (6,405) (29) Tarkwa expansion (196) (6,154) (28) 9 Shaft Driefontein (93) (2,920) (13) Net Deficit Net Deficit (1,023) (1,023) (32,130) (32,130) (148) (148)

  • Current Rand price R213,000/kg
  • Core business has the potential to generate higher cash flow
  • Input cost pressures remain a concern
  • Gold Fields in a heavy capital phase to secure long term production profile
  • Power rationing impacting production
  • Costs and capex to be reviewed throughout the business

If you look at the debt what you’ll see is that’s a net because there is a repayment in there

  • f $260 million and there is also a drawdown of certain working capital loans. The net

cash outflow for the quarter of R143 million leaves us with cash at the end of the period of R1.3 billion. Net debt, if you take into account debt on the balance sheet, translates to about R5 billion. I’m going to talk about that in a moment. What I’ve tried to do on this slide is to disaggregate some of the numbers in the accounts. And all of the numbers here you see are essentially pulled out of the accounts, to actually explain what the core business is really doing and what separate funds we are investing for the future. I have also shown this on a Rand per kilogram basis and dollar per ounce basis. So if you kick

  • ff at the top this shows you the revenue that we generated in the business of R5.4
  • billion. Operating costs from the income statement. So the operating profit is the same

figure I’ve mentioned. Finance cost is part of an ongoing cost, because we have debt on the balance sheet, as is exploration if you’re going to be in the business for long-term. And then what we have done is split the capital up and said, what is the capital we need just to keep these operations moving along where they are? That is that we call sustaining capital, which is R933 million for the quarter. And then taxes and royalties is of course a feature of ongoing business. And what that tells you is that the existing operations generated a surplus for the quarter

  • f about R500 million. That is before considering all other items of investment. And then

what you can see is that we’ve invested in what we call long-term growth and replacement capital projects. At Cerro Corona we put R649 million in, as I mentioned

  • earlier. We purchased the Uncle Harry’s ground which is to the east of South Deep, that

was R400 million. At South Deep we continue to spend money particularly to get this mine up to a world-class operation in the future. So that is for growth, and of course the ounces profile will increase. The Tarkwa expansion we have mentioned, which really brings forward ounces so we can maintain a production profile, but also increases the ounces. And then of course the 9 shaft at Driefontein. And what is interesting is that we’re spending R1.5 billion during the quarter on all of those things. Of course going forward Corona should finish by the middle of the year; Uncle Harry’s is done; South Deep will continue; Tarkwa will be finished by around about September or October. So the burn rate on our capital will certainly reduce as we get into the second half of the year. But I think this gives you a better perspective as to what the business is doing. I think also important to note is that our current Rand price is R213,000 per kilogram. So the core business does have the potential to generate substantially higher cash flows. And I think you can redo the numbers if you go and redo that revenue line at the current price what the impact on the core business would be. Input cost pressures remain a

  • concern. You’ve seen the new inflation stats come out today of 8.6%. Personally I think

we’re going to go higher going forward. The whole power crisis we know is going to translate into more inflation. It is probably going to impact the Rand as well, so I think we could be on a rollercoaster ride going forward here. As I mentioned our heavy capital phase is going to continue certainly for the next quarter. As a consequence of the power crisis we are going to be revealing all of our costs in capital at all of our operations. This just shows the profiles excluding these projects, and then if you superimpose these various projects, South Deep, Cerro Corona, Driefontein etc., that is the impact it has. So these projects are really for the future.

16

Financial Financial

Impact of Growth / Long Term Replacement Capital Impact of Growth / Long Term Replacement Capital

Securing Future Production Securing Future Production

1 000 2 000 3 000 4 000 5 000 6 000 F2008 F2009 F2010 F2011 F2012 F2013 F2014 F2015 F2016 F2017 F2018 F2019 F2020 F2021 F2022 F2023 F2024 F2025 F2026 F2027 F2028 F2029 F2030 F2031 F2032 F2033 F2034 F2035 F2036 F2037 F2038 F2039 F2040 F2041 F2042 F2043 F2044 F2045 F2046 F2047 F2048 F2049 Ounces produced ('000) Total Excl Expansion South Deep Dries 9# Cerro Corona Tarkwa CIP Expansion

slide-6
SLIDE 6

17

Power Crisis Financial Positioning

  • Higher Rand Gold Price could soften production cuts at SA Operations
  • Higher Rand Gold Price could soften production cuts at SA Operations
  • Capital burn rate reduces in second half of the year
  • Capital burn rate reduces in second half of the year
  • R4.2 bn of investments is kitty
  • R4.2 bn of investments is kitty
  • Debt headroom still exists (US$ 726m, R5,1bn current debt)
  • Debt headroom still exists (US$ 726m, R5,1bn current debt)
  • All capital expenditure being subject to review
  • All capital expenditure being subject to review

Our positioning given this power crisis. I think the first point is if we do see the sort of cuts at around 20% of production in South Africa, if we are managing to maintain the current prices that we are achieving today we can actually offset a lot of that decline. So in other words what I’m getting at is the revenue line may not be far off where it is now if we’re

  • nly down 20% and we can stay there. So not all bad news. Capital burn rate, as I said,

will reduce in the second half of the year. But it is critical. They are the key projects that provide the platform for the future and we must continue with that. We do have R4 billion

  • f investments in the kitty. Some of those albeit are strategic, but in a crisis everything is

available to be monetised and used in the business. Our debt headroom is still there. I’ve said to previously that my comfortable debt level is between $500 million and $700

  • million. Notwithstanding that, I wouldn’t be uncomfortable with $1 billion, which translates

into roughly one times EBITDAR. So we still have debt headroom to finance the business.

18

Financial Royalty Bill: Draft 3 (South African Operations)

  • Third draft of Mineral and Petroleum Resources Royalty Bill released on

6 December 2007 and applicable from April 2009

  • Third draft of Mineral and Petroleum Resources Royalty Bill released on

6 December 2007 and applicable from April 2009

  • South African Tax base changed to include beneficiation costs such as

refining, transport and insurance, resulting in 0.4% deduction from Gross Sales

  • South African Tax base changed to include beneficiation costs such as

refining, transport and insurance, resulting in 0.4% deduction from Gross Sales

  • New royalty proposed is based on profitability:
  • Y% = EBITDA/(Revenue*12.5)
  • Compared to a previous fixed rate of 1.5%
  • New royalty proposed is based on profitability:
  • Y% = EBITDA/(Revenue*12.5)
  • Compared to a previous fixed rate of 1.5%

The royalty bill. Just before we went on leave last year the third draft of the royalty bill was released, which effectively changed from a fixed percentage of gross revenue to a sliding scale based on profitability. And also the sales base that is going to be used for this took cognisance of beneficiation costs in our sector, which provided relief to the extent of 0.4%.That is substantially different, however, to what is being offered to other mining

  • sectors. The formula I think you’ve all seen, essentially EBITDAR over revenue times

12.5, which as I said, depending on your level of profitability will determine the royalty. And that compared previously of a fixed rate of 1.5%.

19

Financial Impact of Royalty Bill

  • Royalty sensitivity for September and December 2007 quarters at

achieved gold prices and actual gold prices

  • Royalty sensitivity for September and December 2007 quarters at

achieved gold prices and actual gold prices

Period Period Actual Actual R190,000/kg R190,000/kg Previous draft Previous draft Sept Quarter 2.9% 3.9% 1.5% Dec Quarter 3.0% 3.5% 1.5%

  • Gold industry to make submissions to Treasury
  • Gold industry to make submissions to Treasury

Regrettably what this means is that if you go and calculate what the royalty would have been for the September and December quarters based on the results achieved and the price achieved, we would be paying about 3%. And if you go and redo the numbers on a pro forma basis for those quarters using R190,000 a kilogram, then it goes up to close to 4%. Obviously if you go and do these numbers at today’s price it gets even higher. And that compares to 1.5%. Now obviously this has a very significant impact on our bottom

  • line. It has a very significant impact on pay limits and gold reserves etc. So the industry is

in the process of making submissions to treasury on this, and let’s just see where we get

  • to. With that I’m going to hand you over to Terrence. Thanks.
slide-7
SLIDE 7

Terence Goodlace

21

South African Operations South African Operations Health and Safety Health and Safety

Committed To Zero Harm Committed To Zero Harm

Beatrix 4# and Kloof 7# achieved a million Fatality Free Shifts Comprehensive new health and safety plans Comprehensive new health and safety plans

Thanks Nick and good morning ladies and gentlemen. As normal I would like to kick off this presentation with something about health and safety as it pertains to the South African operations. This quarter again we have placed a tremendous amount of focus on all of our campaign in terms of health and safety to increase awareness, to improve behaviour as regards safety, to advance consequential thinking and ultimately to improve

  • safety. Most significantly we have now generated comprehensive new health and safety

plans, and this is the first time we have gone into such detail in terms of those health and safety plans. But as I’d like to point out to you on the graphs, we do believe that traction is being gained with the safety aspects at the South African operations. Yes, something has happened with the fatal injury frequency rate, and that was primarily as a result of Kloof, and we are now at 0.28 per million man-hours worked. But if you look at the serious injury frequency rate, if you look at the lost day injury frequency rate, I think you would agree with me that it is improving over time. If we look very specifically at the quarter, and bear in mind that Beatrix achieved one million fatality-free shifts at 4 shaft and Kloof achieved

  • ne million fatality-free shifts at 7 shaft during the quarter, and we must commend them

for that, we are in a situation where we were stopped by the Department of Minerals and Energy in terms of the issuance of mine-wide Section 54s.

22

South African Operations South African Operations Health and Safety Health and Safety

So if I start off with the first graph, and that’s the Beatrix graph, what we have here is over a quarter. We had the one fatality in the quarter, very unfortunate in terms of the fall of ground that actually happened there. So that was a tramming accident. At South Deep very similar. We came back, we had the one fatality in the quarter, a fall of ground in a conventional stope. But overall we have recovered the situation as far as those two mines are concerned. And both of those mines are operating substantially below 0.28 per million man-hours worked. Driefontein if you will recall we didn’t have a very good first half of the year last year and we introduced the Masipepe or Let’s Be Safe programme. And I really did believe that we were going very well. And we had one week, I believe, of madness where we had two tramming fatalities and one surface fatality in a truck in an accident which ended in the DME stopping the mine and ultimately we didn’t operate for four days. Bu as you can see from the bottom slide is the rates, the accidents that we had at Kloof, which were just totally unacceptable. It started off with a multiple fatality, which was a result of a spillage winch conveyance and a rope that broke. It ended up with two people dying in an underground explosion, and then we had some fall of ground, and ultimately someone killed in the steep working. This was totally unacceptable, and I have to agree with the DME that the stoppage that we ultimately did have was right in terms of moving

  • forward. Suffice to say these Section 54s did have an impact on our overall production.

23

South African Operations South African Operations Summary Summary

Q2F2008 Q2F2008 Q1F2008 Q1F2008 Gold produced - managed kg 20,432 21,436 koz 657 689 Total cash costs R/kg 101,170 94,248 Operating profit Rm 1,297 1,207 Operating margin % 37 36 Capex Rm 839 740

  • Production adversely affected by:

̵

One day national strike

̵

Safety related stoppages at Driefontein and Kloof

̵

Two fires at Kloof

  • Development show positive trend
  • Capital costs driven by Dries 9# and South Deep

Results Results

If we move on to the South African operations per se, we often speak tongue in cheek about a perfect storm, and I do believe we’ve just about started seeing that storm and ultimately it has actually hit us in this quarter. But production was affected by the National Union of Mineworkers’ one-day national strike. I’ve spoken about the safety-related stoppages at Driefontein and Kloof and the two fires that we had at Kloof. If we look at the impact of that, we believe we lost something like 750kg in the quarter just from the safety- related stoppages at these two mines. The two fires at Kloof resulted in an interruption of something like 160kg for the quarter. One important point is just how we are doing with

  • development. Much has been said about development, how much we invest back into the
  • re body. It is pleasing to say if I look at the first half of last year compared to the second

half of the year we have improved pretty dramatically. We have increased on-reef development by 15% and also improved the total meterage by something like 11%. And this is a positive trend for us, because if you don’t open up the ore reserve you’ve got nothing to mine. So the creation of mining flexibility still remains ultimately very core for us, and we’re very pleased to say that our on-reef meterage for the quarter at 6500m was the highest we’ve achieved since September 2003.

slide-8
SLIDE 8

24

South African Operations South African Operations Impact of Power Interruptions Impact of Power Interruptions 10% Power Reduction ~ 21 % Reduction in Gold Production 10% Power Reduction ~ 21 % Reduction in Gold Production

80 % 90 % 70 % 55 % 100 %

Moving on to power, Ian introduced some of the issues we have with regard to power, but this is extremely concerning for us. And what I’ve tried to predict here is really just a sketch of what has happened to us since last Thursday night. So if we look at the situation as it was, we consumed something like 600 megawatts of power on average (that’s not the peaks) and we generally mill something like 40,000 tonnes a day. Last Thursday night with all of the announcements that we had and the risk that was inherent in the national grid, we were reduced to something like 55% of our power and that basically just goes to our base load. We immediately curtailed all operations in terms of

  • milling. We then resumed at 50% and on Sunday we had actually gone down to even

lower than that. And we were consuming something like 300 megawatt at that time. Post emergency meetings with Eskom and with Ministers and the like it was agreed that we could go back to 70%, and in doing so start making the operations safe. We were effectively stopped dead in our tracks at an instant, without notification, and we said that we need to make our operation safe. We had already been standing since Thursday. And we were granted this dispensation to go back up to 70%. Right now as Ian said we have gone back up to 80%, and as I stand now we are at 80%. And we are hoping this evening to go back to 90%. But I have to say that we are entirely dependant on the national grid and we’re entirely dependant on the rest of South Africa coming to the party to give us the additional power.

25

South African Operations South African Operations Power Strategy Power Strategy

* * * * Low Low Margin Margin High High Margin Margin

In terms of the power strategy and looking forward in terms of electricity supply, what we have done here is put al of our shafts on the bottom access. So these are all the shafts of Gold Fields and we have ranked them in terms of high-margin shafts and low-margin shafts on the right hand side. We then looked at what power we need to operate these

  • shafts. In essence if we were to mothball everything we would use something like 200
  • megawatt. In other words that’s in the situation where all you’re doing is keeping the shaft

ticking over and just pumping up excess water. You would turn off all of the non- productive ventilation and all of the other facilities. Our base load sits at just over 300

  • megawatts. In other words, if we do nothing and we are only production ready, we sit at

something like 300 megawatts. It’s 50% to 55%. So there is a very high fixed component in power usage on any deep-level South African mine. So what we’re saying here is if we are to go to 70%, say Eskom were to say to us that we’re only ever going to get 70%, then it says to us logically that you should focus on the high margin shafts. So we’ve ranked all of our shafts and we know what we would do and what we wouldn’t do. But we are entirely in the hands of Eskom. Eskom have now imposed on us 90% power. So what does that mean? 90% power says that all of these shafts, and there are six shafts, are at

  • risk. If you are to focus this business in the high priority areas then you would focus them

in this part of the equation. An important point to note as well is that mining only uses 10% of our power. In other words the actual mining activity itself only uses 10% of power. It goes back to the very high fixed component that we have, and just how sensitive we

  • are. So take 10% away and then we’ve only got 40% left with which to operate. Ian has

spoken to you about our predictions and what we’re looking to forecast for the quarter, and that is that we’re going to be some 20% based upon the 80% business interruption that I showed you on the previous slide and us modelling in that we will get back up to 90% from later on today.

26

South African Operations South African Operations Driefontein Gold Mine Driefontein Gold Mine

Q2F2008 Q2F2008 Q1F2008 Q1F2008 Gold Production kg 7,451 8,098 koz 240 260 Total cash costs R/kg 94,390 85,058 Operating profit Rm 523 526 Capex Rm 267 219 Development performance

  • on reef lagging

Quality being restored Volumes being restored

  • Significant business interruptions

̵

Section 54’s and national stay away

̵

Seismicity in high grade pillars

  • Overall improvement in safety

indices

  • Consistent underground volumes
  • Cost increased - training and

contractor costs Key issues Key issues

  • Emphasis on Masiphephe Health and Safety Programme
  • Gold production down ~ 20% due to power situation
  • Assuming 90% power scenario – 6,700 kg / quarter

Outlook Outlook

Moving on to Driefontein, Driefontein has come down from 8 tonnes to 7.5 tonnes of gold, and we have had significant business interruption through the Section 54s and the national stay-away as well as some seismicity in some of the higher-grade pillars on the

  • mine. Overall the improvement in safety has been pretty rewarding, other than that week
  • f madness we experienced. The 94% mine core factor was very pleasing and it shows

the quality of mining is where we want it to be. The one disappointing thing was the reduction in underground yields from 8.2 to 7.7, and that was as a result of additional dilution which came through from development as a result of some failed ore passes at 1, 6 and 8 shafts. We’re also about to commence with the shaft sinking of 9 shaft in this coming quarter. I’m not going to go through every slide and talk about the numbers that you see, but this will be repeated in all of the slides. We’re saying about a 20% gold production down in the coming quarter. And assuming a 90% scenario and no other business interruption, we think we will probably be something like 6.7 tonnes of gold per quarter, bearing in mind the power situation on the mine

slide-9
SLIDE 9

27

South African Operations South African Operations Kloof Gold Mine Kloof Gold Mine

Q2F2008 Q2F2008 Q1F2008 Q1F2008 Gold Production kg 7,179 7,319 koz 231 235 Total cash costs R/kg 91,029 86,269 Operating profit Rm 528 473 Capex Rm 226 218 Development performance

  • on reef lagging

Quality being restored Volumes being restored

  • 7 Shaft One Million FFS coupled with
  • utstanding performance
  • Significant business interruptions

̵

Section 54’s and national stay away

̵

Two underground fires

  • Underground accumulations
  • Main on-reef metres up 6%
  • Cost increases - toll treatment and

inflation Key issues Key issues

  • Implement new health & safety plan
  • Gold production down ~ 25% due to power situation
  • Assuming 90% power scenario – 6,000 kg / quarter

Outlook Outlook

Moving on to Kloof, Kloof came down marginally from last quarter. 7 shaft is producing extremely well at this mine. We did have the business interruptions that I spoke about earlier, but in addition to this we’ve also and a whole lot of other interruptions including the two underground fires as well as memorial service day post the accident when the three people were killed. And then we also had an illegal strike which affected one day of

  • production. There have been underground accumulations at the mine over the quarter,

but we’re starting to see that ore come out in January. We had a low mine core factor which was far below our expectations, but we did build up in gold in process and that has been released into January as well as through the Christmas break. Main on-reef metres for the quarter were up 6% and we’re extremely pleased about that. It’s been particularly tough to ramp up development at this mine.

28

South African Operations South African Operations Beatrix Gold Mine Beatrix Gold Mine

Q2F2008 Q2F2008 Q1F2008 Q1F2008 Gold Production kg 3,698 3,707 koz 119 119 Total cash costs R/kg 108,031 106,393 Operating profit Rm 209 163 Capex Rm 142 134 Development performance

  • on reef lagging

Quality being restored Volumes being restored

  • 4 Shaft One Million FFS
  • Production interruption:
  • One day NUM strike
  • Labour unrest at 4#
  • Underground yield increased 5%
  • Main on reef development up 29%
  • Improved performance South Section
  • Quality factors disappoint

Key issues Key issues

  • Ongoing behaviour based safety intervention
  • Gold production down ~ 25% due to power situation
  • Assuming 90% power scenario – 3,700 kg / quarter

Outlook Outlook

Moving on to Beatrix, 4 shaft was proceeding extremely well in terms of its safety. We did then unfortunately have the fatality. But the other aspect which hit us this quarter was labour unrest at 4 shaft where factions climbed into each other and four people died. That did affect the mine for some two days, and its something that still needs to be resolved within the National Union of Mineworkers structures. It is pleasing to report that the underground yield increased by some 5% and main on-reef development. As I said last June and in September we would anticipate an increase in on-reef development based upon the high levels of footwall development that we did in the preceding year. We’re starting to see that come to fruition and a 29% increase is not to be scoffed at. The other component of Beatrix which we’ve really been battling with over the last year is the quality

  • f mining and the mine core factor. We continue to focus on fragmentation, gold recovery

and ultimately some of the other quality factors like scoping width, to actually enhance the yield at this operation.

29

South African Operations South African Operations South Deep Gold Mine South Deep Gold Mine

Q2F2008 Q2F2008 Q1F2008 Q1F2008 Gold Production kg 2,104 2,312 koz 68 74 Total cash costs R/kg 147,719 132,223 Operating profit Rm 37 45 Capex Rm 204 169

  • Mine design and schedule of Phase 1 completed by June 2008
  • Vent shaft brattice wall by July 2008
  • Gold production down ~ 25% due to power situation

Outlook Outlook

  • Operations
  • VCR depleted above 95 level
  • 35 day surface fan breakdown
  • Progress
  • Vent shaft equipping 26%
  • Mobilisation below 95 level
  • Surface drilling program on track

Key issues Key issues

Moving on to South Deep itself, South Deep as come off from 2.3 to 2.1 tonnes, and that is as result of the VCR which I reported last quarter being largely depleted. We intersected the Waterpan fault on the western side of the VCR about 95 level, and that has largely been depleted now. And into the future we will be stopping operations on that

  • reef. There is nothing there to mine and we’re redeploying our labour into some of the
  • ther working areas. The trackless section was unfortunate hit as a result of a surface fan

breakdown, which affected us for some 35 days. We just didn’t have a spare and ultimately we only operated with two out of three fans for a 35 day period, and the underground temperatures were such that we couldn’t operate with the trackless equipment, especially to the eastern part of the mine. As far as progress is concerned on some of the major capital projects, the vent shaft equipping is currently at some 30% up the shaft. It was 26% at year end. We’re also mobilising crews. We have been mobilising crews for two months, as well as equipment, to get the development going below 95 level. And at present we have commenced blasting on 100 level. The surface drilling programme, which is a three to four year programme which we announced last June, is

  • ne track and we have seven drill rigs on site now spread over the surface of South
  • Deep. We are also looking at some underground drilling through some long-incline
  • boreholes. Importantly the mine design and schedule for phase one will be complete in

June 2008. I know this has been a long time coming, but as I’ve reported previously we’re doing extensive geological modelling and we have effectively divided the mine into eight key domains. And we are making fairly good progress. We have finished three of the key main mining areas, or mini-models as they’re called, and we’re on track to start with the ultimate mine design and schedule. And some of the resource modelling is happening as we speak. We do expect that the vent shaft brattice wall will be completed by July 2008, and the refrigeration plants that are so necessarily to cool that mine down should be up and running by August of 2008.

slide-10
SLIDE 10

30

South African Operations South African Operations South Deep Project South Deep Project

Main Shaft -2995mBC Vent Shaft -2791mBC 90-Level 93-Level 94-Level 95-Level 100-Level 105-Level 110-Level 110A-Level

Key Focus Key Focus

  • Production build-up

constrained:

  • Lack of permanent shaft

infrastructure

  • Development behind schedule
  • VCR depleted above 95 level
  • Insufficient geological

information below 95 level

  • Production build-up

constrained:

  • Lack of permanent shaft

infrastructure

  • Development behind schedule
  • VCR depleted above 95 level
  • Insufficient geological

information below 95 level Capex Capex (Rm) (Rm)1

1

Project Project Completion Completion Development below 95 L 2,004 F2012 Vent Shaft deepening 660 F2011 Refrigeration 94 L 163 F2008 Surface drilling 132 F2010

I mentioned back in June once we had been to the board with a whole lot of capital projects which are listed below, it is extremely important for us to finish the infrastructure at this mine. We cannot continue to get any semblance of production if you’re sitting with a twin-shaft complex down to 3km that is incomplete. We’re looking at every way possible to make sure that we finish the bottom structures. Ian spoke about it. We can’t really handle the pumping of dirty water, clean water. We’re not in a position with the total ore handling facilities, and we are completely restricted in terms of getting the work done below 95 level. So it is absolutely imperative that this five year project gets the focus that it does deserve. We do believe that the lack of infrastructure is constraining our activity to build up this mine. It does lead to development being behind schedule, and that is absolutely critical, as is the de-stress mining.

31 ¹ June 2007 Terms

32 km Development 32 km Development

Main Shaft -2995mBC Vent Shaft -2791mBC 90-Level 93-Level 94-Level 95-Level 100-Level 105-Level 110-Level 110A-Level

South African Operations South African Operations South Deep Project South Deep Project

  • Production build-up

constrained:

  • Lack of permanent shaft

infrastructure

  • Development behind schedule
  • VCR depleted above 95 level
  • Insufficient geological

information below 95 level

  • Production build-up

constrained:

  • Lack of permanent shaft

infrastructure

  • Development behind schedule
  • VCR depleted above 95 level
  • Insufficient geological

information below 95 level Capex Capex (Rm) (Rm)1

1

Project Project Completion Completion Development below 95 L 2,004 F2012 Vent Shaft deepening 660 F2011 Refrigeration 94 L 163 F2008 Surface drilling 132 F2010

I’ve spoken about the VCR which has been depleted now at 95 level. And one other aspect that we’ve looked at is that there was a strategy of down dip mining, and that was always put forward in the feasibility study, but we are stopping that. And the reason we’re stopping that is because we don’t have sufficient geological information. And here I talk about micro-information. In other words you can’t advance these massive stopes if you don’t have basic geological information ahead of you. And it’s absolutely crucial for us to get 100 level in, because the down dips come off 95 level. It is absolutely crucial for us to get below the ore body on 100 level, and that will still take us more than twelve months from where we are now.

32

KSDO Project KSDO Project KSDO Scenarios KSDO Scenarios

  • Systematic process used to derive scenarios
  • 64 options considered
  • 6 Scenarios being evaluated at a high level
  • Kloof Case Studies 3 and 5 used
  • Scenarios Modelled
  • Systematic process used to derive scenarios
  • 64 options considered
  • 6 Scenarios being evaluated at a high level
  • Kloof Case Studies 3 and 5 used
  • Scenarios Modelled

Scenario Scenario Description Description¹ ¹ KSDO_1 330ktpm South Deep; 150ktpm Kloof No 4 Shaft - KEA (mod) KSDO_2 330ktpm South Deep; 150ktpm Kloof No 4 Shaft + KEA (mod) KSDO_3 400ktpm South Deep + Short Lift Shaft; 150ktpm Kloof No 4 Shaft – KEA (mod) KSDO_4 400ktpm South Deep + Short Lift Shaft; 150ktpm Kloof No 4 Shaft + KEA (mod) KSDO_5 480ktpm South Deep + Deepened South Shaft KSDO_6 480ktpm South Deep + Triple Declines From South Shaft To Twins Tonnes > 330ktpm for South Deep provides for additional Ventilation Shaft and expanded Metallurgical Plant South Deep Profiles include Mineral Resources from Contiguous Rights (4000mbd)

¹ Ore Tonnes only

One of the other aspects which I’ve spoken about previously, and we promised that we would finish the conceptual studies around the scenarios for South Deep, either as an integrated operation or as a stand-alone operation. We have now competed that work. When we did the analyst day I did go through quite a bit of detail as to what the scenarios were all about and how they came about, so I’m not going to repeat it. But suffice to say the Kloof South Deep optimisation scenario one, which encompasses 330,000 tonnes from South Deep and 150,000 per month coming from Kloof 4 shaft, is the scenario that we are going to advance to pre-feasibility level. I’m not going to go through all the scenarios but specifically focus on the one that we are going to advance

33

N

4# 3# KEA S 8 7 3 1 150ktpm 150ktpm 330ktpm 330ktpm 4 T

KSDO Project KSDO Project Scenario KSDO_1 Scenario KSDO_1

Ore Tonnes only

Just to remind everybody in the room, we’ve got the Kloof mine over here to the west. You have the South Deep mine over to the east. You have the Westrand fault which runs between the two of them. So in the future Kloof 4 shaft complex and the 4 sub-vertical shaft complex will access its reserves over life – and I’ll show you a profile shortly – and ultimately the twin-shaft system would have accessed phase one plus all of the contiguous rights, as well as phase two plus all of the additional rights. And that is what we have modelled in conceptually. So the plan is to create access or platform levels from 39 to 41 level to come across to the deeper portions of South Deep and take 150,000 tonnes per month through the 4 shaft system, marry it with what we’ve got to do out of 4 shaft itself, and then ultimately keep the twin shafts going for 330,000 tonnes per month.

slide-11
SLIDE 11

34

KSDO Project KSDO Project Scenarios KSDO_1 Scenarios KSDO_1

Schematic Diagram Hoisting Capacity 220 ktpm Main Vent Hoisting Capacity 202 ktpm

South Deep

51 Level pump station 84 Level pump station 90 93 95 100 105 110 110A

South 3 SV 2 SV

50 90

Hoisting Capacity 176 ktpm

  • 230.9 m
  • 225 m
Collar (BD)
  • 2,426 m
  • 1,334 m
  • 1,510 m
  • 2,750 m
Vent Raise 95 Level (+-100 000tpm)

1 SV

70 53 56 58 60 63 65 68 71 72 75 78 80 83 85 3 SV Bottom
  • 2,993 mbd
2 SV Bottom
  • 3,006 mbd
1 SV Bottom
  • 2,214 mbd
95A belt level
  • 2,940 mbd

Main # Bottom

  • 3,221 mbd
95

Decline Length 3,146m at 8º

120 115 125 135 130 (-3495 m)

Kloof

22 23 39 41 43 45
  • No. 4

4SV 4 # Bottom

  • 3,723 mbd

4 SV Bottom Upgrade to 180,000 tpm Hoisting Capacity 164 ktpm Surface conveyor

The following really just depicts that pictorially as a section. So you have the 4 shaft, you have the 4 sub-vertical shaft going down 39 to 45 level, and that is sitting at something like 3700m below surface. You have the twin shaft complex going down to some 3km below surface. We have a project which we have approved, which is the extension of the ventilation shaft, which can hoist 330,000 tonnes per month. So the 330,000 will come out there; the 150,000 will come out there via the access route on 39 and 40 level. There will also be an eight degree decline, and that was already part of the feasibility study as was

  • riginally envisaged. So all we’re doing is maximising on the combined infrastructure for

this complex. This is my final slide and it shows what the profile in fact looks like. If you look on the bottom axis it runs from 2008 to 2060. I suspect there will be some other people presenting in 2060. We then have modelled Kloof. This is the Kloof mine as it stands, including 4 shaft. And then what we show here is phase two. This is South Deep ground coming out of Kloof.

35

KSDO Project KSDO Project KSDO_1: Production Profile (Mt)* KSDO_1: Production Profile (Mt)*

KSDO_1 TONS HOISTED 1,000,000 2,000,000 3,000,000 4,000,000 5,000,000 6,000,000 7,000,000 8,000,000 2008 2010 2012 2014 2016 2018 2020 2022 2024 2026 2028 2030 2032 2034 2036 2038 2040 2042 2044 2046 2048 2050 2052 2054 2056 2058 2060 CM&SV1&pillars Phase 1 WA4 Uncle Harry's Phase 2 125 to 135 Phase 3 Dev Kloof incl 4# Kloof Phase 2 &access 330ktpm 480ktpm * South Deep projections as per feasibility study Phase 2 ex Kloof Phase 2 ex Kloof Kloof inc 4 # Kloof inc 4 # Uncle Harry Uncle Harry’ ’s s SD phase 2 Phase 1 Phase 1 Current mine Current mine

All right, so this previously would have come out of the South Deep infrastructure, but this will come out of Kloof. So this is the profile effectively if you had Kloof on its own plus phase two. What we have here is the original feasibility study as it is. We haven’t completely reworked this ourselves. The earliest opportunity we’re going to have to rework this is in once we have finished in June 2008 with our new mining plan off the new computer platform. So we have advanced this. It commences in 2008. That is the build-up as we see it, and those are the various sections of the mine that we would deplete. You can see its just on 4 million tonnes per annum, which equates to 330,000 tonnes per month, plus you have a waste component that would go with it. So you’ve got a very robust profile up to the year 2042, and then the mine depleting up to 2060. Importantly it is now time to take this into pre-feasibility and look at all of the details that are required to advance this strategy. And with that I’d like to hand you over to Glen. Thank you very much.

slide-12
SLIDE 12

Glenn Baldwin

37

International Operations International Operations Summary Summary

Q2F2008 Q2F2008 Q1F2008 Q1F2008 Gold produced - managed koz 362 355 Total cash costs US$/oz 470 468 Operating profit US$m 109 72 Operating margin % 38 30 Capex – excluding Cerro Corona US$m 88 77

  • Production up
  • Overall unit cash costs contained
  • Production levels returned to normal in Ghana from the second half of the

quarter

  • Australian performance mainly in line with guidance

Results Results

Thank you Terence and good morning everyone. The international operations have provided a consistent overall performance for the quarter with managed gold production up to 362,000 ounces. The cash costs were kept steady quarter on quarter at around $470 an ounce. The cap ex programme continued on the following main projects. At Tarkwa we continued cap ex on the CIL expansion project, as Nick said, and the phase five heap leach. We also spent money at Cave Rocks and Belleisle underground projects at St Ives, the Damang cutback yet again, and advanced brown fields exploration projects at Damang and in Australia. During the quarter however we did have three fatal accidents at Tarkwa, which obviously we’re very disappointed by. However, at Damang, Agnew and St Ives they’re still fatal-injury-free since Gold Fields acquired them. We do remain committed to the principles of zero harm, and we continue to drive behaviour on each site to eliminate all accidents.

38

International Operations International Operations Tarkwa Tarkwa Gold Mine Gold Mine

Q2F2008 Q2F2008 Q1F2008 Q1F2008 Production koz 158 154 Total cash costs US$/oz 413 423 Operating profit US$m 61 38 Capex US$m 46 43 Development performance

  • on reef lagging

Quality being restored Volumes being restored

  • Three fatal accidents
  • Rainfall stopped in the last half
  • f Q2
  • Electricity supply stable, but with

tariff increases Key issues Key issues

  • Production up by 6%
  • Cash costs slightly higher due to increased power tariff and fuel
  • CIL Expansion Project: cost increase from $126 million to $161 million due to foreign

exchange exposures, cost escalation and minor scope changes Outlook Outlook

Firstly at Tarkwa where production was up and costs were better than the previous quarter, mainly due to the increase in ounces. The abnormally high rainfall that impacted

  • n production in quarter one abated only halfway through the second quarter, but it did

enable the mine to recover somewhat. And indeed production for the next quarter is expected to be about 6% higher, aided by the end of this wet season. The CIL expansion project which will deliver more gold in F2009 and beyond at Tarkwa is progressing well. However the total project cost unfortunate is expected to increase from around $120 million to around $160 million. The key reasons are changes in foreign exchange cost escalation and some minor scope changes. I suppose the impressive thing is it is only minor scope changes.

39

International Operations International Operations CIL Expansion Project CIL Expansion Project – – August 2007 August 2007

This is a photo of the CIL plant at Tarkwa. You can see this little place in here, we’re going to put in an additional eight or nine CIL tanks. There are the seven existing CIL

  • tanks. There is the one thickener we have at the moment, and that is the two thickeners

that are being constructed. So we’re actually doing an expansion project in the middle of a producing mine’s main factory here.

40

International Operations International Operations Ball Mill Construction Ball Mill Construction

August 2007 January 2008

Construction progressing well despite high rainfall

And you can see the mill, which obviously has been turning because we produced a lot of

  • gold. And you can see this tiny hole in the red circle. In the red circle, that is what it looked

like back in August. And you can see our new mill has been put on its foundations in

  • January. Because of that we’re convinced that we will be able to deliver this project on

schedule, which is in quarter one of F2009. However, I just want to flag that if the South African power situation doesn’t improve we may be at risk of not getting some of our later supplies of steel, specifically those for those CIL tanks. That may push it out a month or two.

slide-13
SLIDE 13

41

International Operations Tarkwa Mine -Tyre Retread Facility

Extruding Machine

First Tyres Retreaded in January 2008

At Tarkwa it’s just worth putting this one up because last time we put it up at analysts’ day we said we were putting in a tyre retread factory. That project is finished around about on

  • schedule. It was on cost, and you can see that we are starting to retread tyres, and they

should be on the trucks as we speak today.

42

International Operations International Operations Damang Gold Mine Damang Gold Mine

Q2F2008 Q2F2008 Q1F2008 Q1F2008 Production koz 44 47 Total cash costs US$/oz 605 468 Operating profit US$m 9 10 Capex US$m 8 7 Development performance

  • on reef lagging

Quality being restored Volumes being restored

  • Lower than expected grades

from surface stockpiles

  • Mining contractor cost increases
  • Increased tonnage from pits

replacing lower cost surface stockpiles Key issues Key issues

  • Similar production due to failure of in pit haul road in Damang Pit Cut Back (“DPCB”)
  • Alternative access to DPCB commenced in Q2 and will be completed in late February
  • Total cost similar, but cash cost increase due to completion of DPCB capital strip

Outlook Outlook

At Damang the production was lower and the costs increased. The lower production was mainly due to lower grade stockpiles. The cost drivers were the reduced ounces from the lower-grade material being treated, and a step change upwards in the mining contractor

  • costs. The lower-grade stockpiles carry zero cost and can actually be more profitable than

pit mining because of this. The increase in the mining cost was due to longer haulage distances, deeper mining levels in the Damang pit as we go lower, and an increase in drill, blast and the annual labour cost increase for the contractor as well. Furthermore, a transformer at the main substation, which actually is located next to Tarkwa, caught fire, which impacted on power at Damang, resulting in an increase in the cost of power self- generation quarter on quarter and a little loss of flexibility because of the power spikes. The outlook for Damang for the next quarter will only remain steady due to the recent failure of the in-pit ramp in the Damang pit cutback. I say ‘only’ steady because we did

  • riginally forecast it to increase. Fortunately though we have put remedial actions in place

a few months ago in anticipation of this ramp possibly failing, and therefore we expect similar costs going forward on a total basis for Damang.

43

International Operations International Operations St Ives St Ives Gold Mine Gold Mine

Q2F2008 Q2F2008 Q1F2008 Q1F2008 Production koz 110 102 Total cash costs US$/oz 521 551 Operating profit US$m 28 12 Capex US$m 26 21 Development performance

  • on reef lagging

Quality being restored Volumes being restored

  • Higher grade underground ore
  • Leviathon pit on schedule
  • Increase in third party royalty
  • Belleisle development impacted

by high volume water intersection

  • Production and cash costs similar
  • Cave Rocks project on-track for Q4 start-up
  • Belleisle project schedule slippage by a few weeks due to water intersection
  • Production at around 120koz per quarter by mid calendar 2008
  • Brownfields exploration program continues with promising intersections

Key issues Key issues Outlook Outlook

At St Ives gold mine the quarter’s production was in line with the forecast, as we continue to develop the new projects which are Cave Rocks and Belleisle underground. The Leviathan pit project also remains on track and looks very exciting. These projects will provide the backbone of St Ives production from the middle of the year, when we expect to be back at more consistent levels of production. The costs at St Ives were contained during the quarter due to the increase in grade from underground at the Leviathan complex and higher volumes from the Leviathan pit. In the next quarter we expect the costs to remain similar.

44

International Operations International Operations Agnew Agnew Gold Mine Gold Mine

Q2F2008 Q2F2008 Q1F2008 Q1F2008 Production koz 49 51 Total cash costs US$/oz 419 430 Operating profit US$m 11 12 Capex US$m 8 5 Development performance

  • on reef lagging

Quality being restored Volumes being restored

  • Expensive high grade stockpiles

depleted

  • Problematic stope start-ups
  • Similar production levels
  • Significantly higher cash costs due to increased throughput of lower grade Songvang

stockpiles

  • Reducing mine production from mid calendar 2008 due to depletion of surface stockpiles
  • Accelerated exploration program to define near surface resources

Key issues Key issues Outlook Outlook

Finally at Agnew production was slightly lower due to processing Songvang pit high-grade stockpiles, which reduces throughput. The underground mine did have some difficulties in

  • pening up stopes, but these short-term problems have been addressed and we look

forward to improved tonnages from the underground into this new quarter. The cash costs were maintained in the quarter. However, we expect them to increase significantly in the next quarter due to the treatment of now low-grade stockpiles from the Songvang pit which finished mining middle of last year. We however do expect that the total cost will remain similar, thereby protecting the margin. These low-grade stockpiles will be fully depleted in this financial year, which will then see a reduction in the total production from Agnew from around 50,000 ounces a quarter to around 35,000 a quarter. We will maintain the accelerated exploration programme at Agnew, and we aim to prove our open-pit

  • pportunities to increase the base load of the mine. It is a very exciting prospect at Agnew

and we feel comfortable that we have identified a few targets to date.In closing the past six months have focussed on maximising production in unusually wet conditions in Ghana, coupled with power shortages. In Australia the focus has been to bring new projects to production at St Ives and find alternative sources at Agnew. For the quarter ahead we aim to capitalise on the work that we have done in Ghana, which is why we will continue to see the increase in production this quarter, and also work towards making sure that we maintain our production levels more safely and with improved margins. With that I’ll hand over to John.

slide-14
SLIDE 14

John Munro

46

Introduction Introduction Cerro Corona Project Cerro Corona Project

Good morning. I’ll talk a bit about the Cerro Corona project in Peru, which is clearly our most important development project across the organisation. I think in terms of an

  • verview I think we’re finally getting our nose over the rim of this project and can see

some light ahead of us. At the end of last calendar year we announced a delay in the project and a substantial increase in the capital cost. I think the remedial actions that we have taken are starting to bear fruit, and we are now starting to look beyond the construction into the transition to an operating project. This is obviously a critical project for Gold Fields with a potential to deliver something like a 20% increase in our annual

  • EBITDAR. Just in terms of an overview from a health and safety point of view, we had a

fatal accident on the power line construction activity. This was being undertaken by a

  • contractor. The really tragic part of this accident, apart from the human aspects, is that the

individual who died was in fact employed by this company but not supposed to be involved in the activity that killed him. He was walking past and saw that the power line which was being strung between the various pylons had become snagged and decided to be helpful. And that ultimately led to him losing his life. So as always an extremely avoidable situation but extremely tragic from all points of view. The project had an excellent track record on safety up until that point, having achieved something like 12 million man-hours lost time injury-free, and was heading for an all-time record for a Latin American construction project. From a community point of view things remains very stable around, notwithstanding disruptions in the broader Peruvian mining industry. We had a significant event in the quarter where we managed to open the 501 bypass road. This is the road that takes the community access off our property. And apart from increasing the safety on the site and the productivity, it was important in that it was being prevented by a small group of people. We managed to align ourselves with the broader community to impose the collective will against the small group who were looking after their own interests. In terms of operations on the site, the only significant operations we have undertaken at the moment are the mining operations, with quite considerable volumes coming out of the pit from a waste point of view. There are fairly small volumes

  • n ore, and that is predominantly oxide. We have done some sulphide mining over recent

periods though. And the significant amounts are coming out of the quarries that are

  • bviously being used for the construction of the tailings dam embankment which I’ll talk

about further on. It is just worth noting that at these sorts of volumes we are exceeding the volumes we will actually mine at once we are on full production. On an annual basis we will only do about 12 million tonnes per annum at a maximum rate. So the mining

  • perations have been ramped up for quite some time.

47

Overview Overview

  • Health and Safety
  • Fatal Accident on power line construction
  • Health and Safety
  • Fatal Accident on power line construction
  • Community
  • Stable
  • 501 bypass road opened without incident
  • Community
  • Stable
  • 501 bypass road opened without incident
  • Operations
  • Operations
  • Cost and schedule
  • Capital cost inline with revised plan
  • Concentrator construction on revised plan
  • TMF construction improving
  • Cost and schedule
  • Capital cost inline with revised plan
  • Concentrator construction on revised plan
  • TMF construction improving

Kt mined Kt mined Waste Waste Ore Ore Quarry Quarry Total Total Q1 4,006 867 2,685 7,558 Q2 4,197 336 3,441 7,974

Then on a cost and schedule, we are at this stage on track from a schedule and cost point of view according to targets we spoke about in November/December of last year. Focusing on the plant construction a bit, we spoke at the end of last year about the big challenges we faced in achieving the productivity and cooperation with some of the major construction contractors. In December we completely renegotiated those contracts from a time point of view and a structure point of view. We also wrote off any previous claims from both sides. The relationship has substantially improved as has the performance of this contractor. This has resulted in us actually achieving the milestones that have been set between the beginning of January and completion of construction in the second quarter of this calendar year or the fourth quarter of the fiscal year. So much better progress is being made there and the relationship has substantially improved because both parties are now getting out of this what they need. In the month of January some of the service areas, including the filters as well as the crusher, have been released by this contractor, so we are now into the final completion of the electrical and instrumentation installation as well as moving into commissioning.

slide-15
SLIDE 15

48

Construction Update Construction Update

  • Plant Construction

̵

Contracting revised and incentives introduced

̵

Performance substantially improved

̵

Achieved mid and late January deadlines

  • Release services and crusher

̵

Flotation circuit critical

  • Piping and instrumentation
  • Engineering - complete, field support only
  • Power supply
  • Incoming supply largely complete

̵

Coastal power line upgrade due to regional demand

̵

Corona limited to 3MW max draw until late March – non critical

  • Procurement

̵

Only capacitor bank for Trujillo substation outstanding

̵

Major equipment, piping, valves and instruments – OK

The really critical area that remains in the construction is the floatation building. This is a very complex floatation circuit, so very complex piping, electrical and instrumentation. That is the biggest focus area, and in fact what we are doing is making sure the primary contractor focuses inside this building and other areas that are ancillary we take away and give to smaller contractors or swat teams to ensure this part of the plant is delivered

  • n time. Engineering on this project is complete. The engineering team really only

focussed on field variance or field changes. Procurement is also complete and all the focus now is on the expediting. The only area that we have some concern is the capacitor bank that is required for the [unclear] substation. This is a major substation on the coastline from which we will draw our power. This, along with a thing I’ll talk about further

  • n, is a late change that the power regulator required of it. Now we aren’t short of power

in Peru; they want to make sure the northern Peru distribution circuit remained stable. And that required us to install this capacitor bank as well as limiting power to us and one

  • ther project in the area for the next two months. Other procurement, there is nothing else
  • utstanding that we can see after thorough reviews that can stop the start-up of this

project in terms of piping, valves, instrumentation and that sort of thing. In terms of power supply, as I’ve indicated, the incoming power supply in terms of the power line and the major substations in complete, and there are two aspects. One is the capacitor bank, which is not a critical path at this point in time and would have to slip quite far before it affected us. And the other one is the upgrade of the coastal power line, which is the national grid, and that is expected to be complete by the end of March. Until that date we will be limited to a maximum power draw of 3 megawatts on the Cerro Corona site. That does not affect any activities there, and we only require our full draw when we move to

  • re commissioning, which we have indicated will be in the middle of the final quarter of

F2008 or the June quarter. At this stage uncritical, but obviously being watched very

  • carefully. The contractors actually doing the work for us on our power line installation is

actually doing this installation, so we’re able to track progress very carefully.

49

Tailings Management Facility Construction Tailings Management Facility Construction

  • Bulk fill
  • Suitable materials available on demand
  • Not critical
  • Critical path
  • Collect water for start up
  • 500 000m3 impounded by end May

̵

Complete embankment to 3672m RL

̵

Commence impounding water asap

̵

To sustain operations through dry season

  • Engineered materials for filter zones
  • Substantial progress in mining, crushing and screening
  • Now building stockpiles of filter zones materials
  • Impermeable and semi permeable clay zones
  • Critical path – placement of impermeable zone
  • Placement in wet weather constraint

̵

Sourcing alternative materials

̵

Wet weather placement improvements

̵

15 weeks at current rates, 10 weeks at target rates

The other area that was key in terms of achieving this project start-up was the tailings management facility or tailings dam, as we refer to it in this country. The critical path – and this is not actually to affect the start-up of the plant; we don’t need much water to start the plant – is really making sure that by the time the rains finish in about late May that we have about half a million cubes of water stored in this impoundment. And this is important to get us through the dry season that inevitably follows the completion of rains in May. And that dry season continues through to October/November. So the critical thing is to make sure the tailings dam embankment is high enough to accumulate 500,000 cubes of water ahead of the rain stopping. So it doesn’t really affect start-up, it affects making sure we can maintain operations through the dry season.

slide-16
SLIDE 16

50

Schematic of TMF construction + empoundment Schematic of TMF construction + empoundment

Now rather than talk to the detail here, I’ll just talk a bit about what the tailings dam looks like and show you a bit of a cartoon schematic. This is a view down a valley with very high sides up to 200m in vertical height. So this is looking down the valley, and you would have had historically a small river running down here. These are the two sides of the

  • valley. And we’re going to construct a wall across the bottom of the valley and impound

the tailings ahead of it. So it’s a valley fill and a tailings impoundment. So the first step undertaken was the clearing of the footprint, removing topsoil and getting down to

  • bedrock. And that was completed in about October of last year. Then the back of the

tailings dam is what we call the bulk fill. This is really bulk rock that is mined from the quarries, but has to achieve a certain geotechnical spec, which we initially had trouble meeting because of dykes that we encountered in the quarries. This zone provides the structural strength to the tailings dam, and ultimately this zone will reach some 160m above the valley floor. Now this has moved very far in advance of the construction of the rest of the zones that move upstream. This in fact has got above the critical level to store water, so it is well off the critical path. We then move into the two filter zones that I’ve spoken about previously and they are the main culprit in delay. We were struggling to reach the geochemical and geotechnical spec on producing the crushed material that goes into these two filter zones. So this zone provides the structural strength; this is meant to filter any water that gets through the zones that sit in front of it, which are two impermeable zones. This is a high-quality layer which is supposed to be completely impermeable, and this is a slightly lower-quality clay zone that is semi-permeable. And there on the face of the wall we would then have another armouring to protect these two clay zones from the water and the tailings. And so where the construction sits at the moment is that this has got well advanced. We have made very good progress in taking the mining and crushing and screening of the two engineered or filter zones off the critical

  • path. We have made good progress on those. In fact, we are now stockpiling those

materials so there is no longer dependency on the production of these two, which was what was really worrying us at the end of last year. The critical path now sits in getting this impermeable clay layer fast enough to make sure the whole dam wall rises fast enough to impound half a million cubes. And the challenge we have is predictably we’re in the rainy season, and this clay has to be placed to a very high QA/QC spec. So when it rains we have to be very careful how we place it. If it gets too wet you can’t place it any

  • longer. Over the last two months we’ve made a lot of progress in finding alternative ways
  • f placing this clay to get our productivity up on that. And that’s things like sloping the clay

so that water runs this way and can run off, doing it in smaller lifts where we can control the QA/QC, and also making sure that when it rains we put in place much drier clay. We have various sources of clay across the site. We are no longer limited on the sources of clay, so now when it rains we can put the drier sources in. And I think we’re starting to make good progress in taking this off the critical path and taking the whole construction of the tailings dam off the critical path. At this stage, to give you a sense, we are achieving about 4000 cubes a week being placed there. If we can continue at that rate we have 15 weeks to complete the tailings dam to the required height. Our near-term target is to get that up to 6000 cubes and drop that to ten weeks. And we think that with the wet weather placement techniques we should be able to achieve that. Once we get it up a bit further, probably in February some time, we will commence impounding water ahead of the tailings dam. And this then will be our reservoir for water through the dry season. Once this water comes up the dam needs to be accessed from all roads along this face. Those will then move down to this side as these roads get covered with water.

slide-17
SLIDE 17

51

Macro Project Schedule Macro Project Schedule

Q3 F2008 Q3 F2008 Q4 F2008 Q4 F2008 Q1 F2009 Q1 F2009 Q2 F2009 Q2 F2009

Concentrator

Construction Cold commissioning Water commissioning

Start up

Hot commissioning on ore Full production

Tailings Management facility

Construction to 3672L Commence impounding

Infrastructure

Power restrictions

Moving on to schedule, the most important part of this is obviously the completion of the construction of the concentrator, which we expect by the end of the March quarter. That will then move into the final commissioning and then water commissioning into the middle

  • f the June quarter, keeping us on track for the date we set at the end of last year, which

is hot commissioning of this plant or introducing rock into this plant by the middle of the fourth quarter of this fiscal year. It is quite difficult to predict how long it will take the plant to reach full production as well as achieve the quality specs, but we have allowed in our planning about four months, which I think is a good, middle-of-the-road number. Some plants can do it in less than a month and some take six months. But this is a relatively straightforward project. Once we get going, given we’ve had a lot of time for planning, we don’t expect too many difficulties in getting it up to full tonnage, which is on an annualised basis 6.2 million tonnes per annum. Obviously the TMF has got to be complete in time to a certain level to impound the half a million cubes of water to get us through the dry season, and we’re keeping track of the power but we don’t expect that to get onto the critical path. So we’re on track in terms of the deadline we get out previously.

52

Construction Capital Cost Construction Capital Cost

US$m US$m November estimate 401.0 Contingency 20.0 Total revised forecast 421.0 Contingency used Contingency used US$m US$m Construction reprogram 5.5 Freight and duty 1.5 Civils and earthworks 2.6 Crusher hire 1.0 Extension of time 2.5 Total contingency used 13.1 Unutilised contingency 6.9 US$m US$m Forecast to completion Forecast to completion 421.0 421.0

Moving on to capital cost. In December of last year we announced that the revised estimate had reached $401 million, and above that an additional $20 million of contingency or headroom. We have utilised some of that contingency as set out here, but you can see almost all of that is being used to see that we achieve the schedule date, the most important being reprogramming the construction activities. In order of magnitude, every month that we can accelerate completion of this plant saves us about $6 million in fixed costs of having the construction team there and having them in the camp and all the ancillary services. And that is obviously before the costs of accelerating production. So spending money to make sure this thing comes on time obviously makes sense. Other things like expediting of outstanding materials is clearly happening. This crusher [unclear] was to make sure that we could produce materials for the filter zones more efficiency. So we’ve still got some contingency unutilised. It is tight, but given where we are I think we should be able to stay inside the forecast of $421 million to complete the construction of this project.

53

Cerro Corona Cerro Corona – – Transition to Operations Transition to Operations

  • Manpower
  • Operating and leadership team complete
  • Manpower
  • Operating and leadership team complete
  • Operational readiness
  • > 1 year mining operations
  • Metallurgical team training continues
  • Plant commissioning
  • Support and services
  • Trial runs on new activities
  • Systems and procedures testing
  • Operational readiness
  • > 1 year mining operations
  • Metallurgical team training continues
  • Plant commissioning
  • Support and services
  • Trial runs on new activities
  • Systems and procedures testing
  • Risks to start up
  • TMF clay placement
  • Continued progress on construction
  • Power restriction
  • Risks to start up
  • TMF clay placement
  • Continued progress on construction
  • Power restriction

Finally in terms of the planning, obviously the move to operations is where we are now, making sure that when this plant is finished it ramps up quickly and delivers the kind of production and profits we expect from it. We have now an entirely complete operations and leadership team. It has taken quite a long time with shuffling of people, but we now have the strength of team and the depth that we require. In terms of operational readiness, as I said the mining operation has been performing as is required pretty much for the last year. So apart from normal production intensity nothing really ahs to change

  • there. We have in fact been mining oxide and sulphide ores, so our grade control and

scheduling programmes have been operating and tested over the previous months. The metallurgical team is obviously where the focus is. We have in fact had most of our

  • perators and supervisors deployed on other concentrators throughout Peru to increase

the training of those people and make sure they’re prepared when this plant starts up. For instance, we also have the whole control system operating in a classroom to make sure that is going to be flawless in terms of start-up. And obviously all the other support and services, making sure that all the bits and pieces that are required to bring this operation together are not going to drop us when we start producing concentrate. And a good example of that is actually trialling hauling concentrate from the mine down to the port at Salaverry, which is about 250km, and making sure a truck is not going to run over a bridge that can’t support it. We have time to do it and we’re making sure we’re not going to hit a surprise later in this year.

slide-18
SLIDE 18

54

Introduction Introduction Cerro Corona Project Cerro Corona Project

LOM Salient Features LOM Salient Features Ore 6.2mtpa Au 150koz Cu 57mlb Cu (26kt) Au equiv* 360koz pa* Strip ratio 0.58 X Cash costs ~ US$320/oz Capital US$421m

EBITDA contribution* = (0.15*900 + 57*3.3) EBITDA contribution* = (0.15*900 + 57*3.3) – – (120) = ~US$203mpa (120) = ~US$203mpa

* Au equiv and EBITDA calc : US$900/oz Au and US$3.3lb and typical LOM parameters

Then in summary, I think in the risks to start-up I would put the TMF construction at the top of the list. We have to get that in and capture some water ahead of the dry season. I’m more concerned about that than the plant now, given that we’re making good progress with the contractors. And success tends to breed success. Bonuses and that tends to bring energy back into the whole process, and obviously the relationship has improved a

  • lot. Also, if we can keep that on track we can get the plant finished on time, and then it’s

about making sure the power restrictions don’t catch us. But they are currently off the critical path. So then in summary, just to go through the KPIs of this project, it is very significant for Gold Fields in terms of international growth. On an average basis throughout its mine life this will produce about 360,000 ounces a year of gold equivalent – that is converting the copper into gold at the prices set out at the bottom here. We are still predicting typical cash costs in the region of $320 an ounce. That can vary, depending on how you do your gold equivalent calculation. Also remember that one of the things that drives your total cash cost is the smelter terms, which are geared to the copper price at the moment, which in fact was intentional to provide us some sort of hedge against declining copper prices. Although we never foresaw $7000 a ton copper which we are enjoying at the moment. But if you were to put current metal prices into the EBITDAR equation, our average life of mine production levels and our typical cost structure as we see it in this market, this mine will produce about $200 million a year of EBITDAR. And you’ve heard Nick speak about this company currently producing about $1 billion of EBITDAR, so it is a very significant uplift in our profitability in getting this mine into

  • production. Hence the huge focus on achieving that. Thank you.
slide-19
SLIDE 19

Ian Cockerill - conclusion

56

Conclusions Conclusions

  • South African power constraints
  • Q308 South African production down 20% to 25%
  • Focus on high margin production
  • South African power constraints
  • Q308 South African production down 20% to 25%
  • Focus on high margin production

Higher Gold Price Higher Gold Price

  • South Deep power constrained options under review
  • South Deep power constrained options under review
  • Cerro Corona production in Q1 09
  • Cerro Corona production in Q1 09
  • Capital prioritisation underway
  • Capital prioritisation underway
  • Q3 International production to rise by 3%
  • Q3 International production to rise by 3%

Thanks very much John. I think just in conclusion, just to leave you with a few key points, clearly the Cerro Corona project is very important to us. You’ve heard John say that this is now online for coming into production in the middle of this year. And certainly concurrent with that would obviously be a reduction in our capital expenditure and a nice, healthy increase in the bottom-line earnings as well. So you can see towards the latter half of this year significant change in the financial dynamics of this group. Obviously in any power- constrained situation everything has to be under review, including all of our capital

  • projects. It may be that certainly for a short period we could become a little bit

constrained, although thankfully the gold price is certainly playing to our advantage at the

  • moment. But I just want to leave you with a very clear message that nothing is going to be

sacred, and we will be looking at all aspects of our operations to make sure that we can see ourselves through this difficult period. As far as South Deep is concerned, I think again the key message to leave you with there is the absolute, essential need to get this infrastructure up and running. The only way that we’re going to be able to build up – and we have seen this over the past twelve months. We tried to keep ourselves moving ahead – but the only way we will be able to keep on building our production on this operation up to sustainable levels is by making sure that we get that infrastructure in place. So clearly that is where the emphasis ahs to be. And

  • bviously as a result of the optimisation study that Terrence alluded to, we will be going to

the board and we will be recommending the start-up of the development coming across from Kloof and linking up with South Deep. As far as our South African operations, again just to reiterate that for the current quarter ahead of us we will be looking at somewhere between 20% and 25% drop in production. And clearly here our focus is going to be on those shafts on Terrence’s graph which are to the left hand side of that final block, which is clearly now at risk. We have to look at innovative ways of making sure that we don’t keep things going unnecessarily. And in fact at the 90% power allocation we probably wouldn’t be able to mine them in any case. However, that is going to be counteracted by the pleasing increase that we should be looking at on the international production. And certainly this is one quarter where Glen and the international team need to help bail out Terrence and the South Africa guys, and counterbalance the drop-off that we will have in the local operations. But you heard Nick talk about how, even though we’re going to have a lower production in South Africa, with the higher price that we’re getting now we should be in a steady-state condition in terms

  • f revenue. Ally that to the increase in revenue that we’re going to get from the

international operations. I think you can do the maths and you can see where we should be heading out. So we have gone through that tipping point in the gold price where we will start seeing the higher gold price starting to outperform the input costs and driving up the

  • margins. So we’re looking forward to the next few quarters. Certainly this current quarter

we are in is going to be tough, but I take my hat off to the guys in the SA ops. The amount

  • f work that they’ve put in over the last week or so as a result of this power problem is

actually quite phenomenal. And as tough and as critical as the situation is, I do believe that we’ve got the calibre of people and the willingness of those people to actually see us through this problem. So it is a huge problem. Yes, it is not the end of the earth. And with that, thank you very much indeed and let us take some questions as you’ve got them.

slide-20
SLIDE 20

Questions and Answers

Muneer Ismael from Deutsche Bank. Ian, maybe just hold on for Nick. I’ll maybe chat to Nick first. You put together a scenario that looks quite optimistic. You talked about R500 million of free cash flow potentially coming off the current operations at R170,000 per

  • kilogram. Granted, at R213,000 per kilogram that is going to be way better, given the gearing that our companies enjoy. The big

problem though Nick, and this isn’t to burst the bubble here or anything, the big problem is we are going to see a 15% hit on the SA

  • ps and we are going to see an increase in Rand per ton costs. Can you give me an idea of what you are forecasting the result will be

from cutting production in South Africa, given the Eskom blunder? What would that result in on a Rand per ton basis? Nevertheless, lower production out of South Africa together with increased Rand per ton costs, what do you then think you free cash flow would look like given that scenario? Have you guys run those sorts of scenarios through? Look I think the important thing to say on the figures I’ve put up there is that is based on the actual results. What I’ve given you there is the actual. Broadly, if you saw a 20% drop in production with current prices, then you’re going to have the same revenue as this

  • quarter. But I think in looking at the cost figures the realistic scenario is that our costs probably won’t change that much. As we said

we’re going to have a group-wide review on all of our costs. But I think in the short-term you’re not going to see a material change in those costs. So the easiest way for you to model is to take the current Rand costs that we are incurring and use that as a base to project going forward. That is the safest thing for you to do. Obviously this thing has hit us since last Thursday night. We are sitting down with all of the operations to go through these profiles and see what can be done in the short-term and the longer-term, both on capital and on working costs. But I think for the next quarter the most realistic scenario is to use the current costs to work out the impact. And then on South Deep, I’ve been getting a lot of questions from clients with regards to South Deep and how this electrical situation will affect South Deep. Now, reading between the lines from what Terrence was saying, what Terrence was suggesting is that you guys are going to focus on development, which kind of suggests production will be a risk. So I think we possibly could see two tonnes

  • f gold being dropped out of the bottom here. Is it correct to make the assumption that you would rather use that power elsewhere and

you will focus on development at South Deep? Should we factor in lower production from South Deep for the next few months or year? I think the point that was made by Terence is that obviously the VCR is going to be curtailed. It is going to stop because there is nothing left there. Certainly as we see it now we’re going to try our best to keep as much activity going there as possible. Obviously the trackless section by its nature tends to be less power-intensive than the hand-held VCR section. So in fact the closing down of the VCR is quite helpful. But we look at each mine in the group on a stand-alone basis, but then we look at group priorities as well. To be honest with you, everything is under review. But as things stand at the moment there will be a concentration on development at South Deep, both for the shaft infrastructure and the opening up of ore reserves. We have made the conscious decision to move from hand- held de-stress mining to mechanised mining. That will start coming into play over the next couple of quarters. And then there is

  • bviously the production. I guess the answer to your question is, I wouldn’t look just at South Deep and say is that at risk. I would say

to you look at the whole group on the South African side and say what potentially is at risk. We need to allocate the power that we’re going to be given by Eskom where we can get the maximum return. I think that is what shareholders would want to see. However, as I said at the beginning, South Deep is a critical component of Gold Fields’ future, and obviously we’re not going to do anything that is going to prevent that future from being delivered. So we have to look at our development, we have to look at the stoping, but we have to look at it in the total picture of the South African operations. Its not so much what we can afford; it is what we have the power for and where we can best allocate that power. Alan? Hi, morning guys. Just a couple of quick questions on the dividend. You skipped the dividend this quarter. Am I right in thinking in your existing dividend policy that would have been around 80c or thereabouts, just to put a number on it? Given that you’ve got this kitty, fairly healthy balance sheet, high gold price and you’re coming out of a high cap ex phase, what exactly… I know the situation is abnormal, but could you just indicate so that we can get idea of how much you passed up and some of the reasons why, and what worries you, given that you’re not in a parlous state financially. And also, in the final dividend will there be some make-up if things improve? Will you pay a larger dividend or will you stick to you dividend policy then? Or could we even see the situation worsen and the final dividend get foregone? Alan I think the decision on the dividend is purely a function of the power crisis that hit us a week ago. If the power crisis hadn’t of hit us we would have paid a healthy dividend. And we would have looked very carefully at our policy and tried to apply our policy. Our general view is to try and apply our dividend policy where we can. Regrettably when you get hit with these kinds of interruptions the way we were hit a week ago, when you don’t know if you’ll be producing at all or at what level, then it makes it extremely difficult to try and do financial planning. And the safest view we took was that we should delay any payment of the dividend. In the second half of the year we can reassess the situation. And also Eskom said they were going to be out for four weeks, and against that background how do you determine to pay a dividend of any quantum? So we will look at this in the second half of the year. Its impossible to say at this stage what we will pay at the end of June, should we elect to pay a dividend again. But clearly we would obviously need to take into account the effect on the full year in terms of our earnings, the effect on the full year of these power interruptions and will be in a better position then to make a more informed decision.

  • Thanks. And then just a quick two for Terrence. You’re stopping the VCR mining at South Deep. Could you guide us on grade

perhaps? I see you still had some development on the VCR at South Deep, which is really high grade. Are we going to see lower- grade production coming out at South Deep with the loss of the VCR horizon? And then perhaps to Nick, if you could just go back to the number of shares that get issued to Mvela next year. When is that and how many shares? I think you said we’re at the floor, but I was thinking we’re kind of mid-way there, 50 million shares. Could you just say when those shares will be issued, and more or less

slide-21
SLIDE 21

how much, given that we’re in a higher Rand gold environment today? Alan, the first thing on the VCR. There is no critical mass there. So whatever we did develop is pretty remote and it’s not going to lend itself to any sort of economies of scale and any sort of volumes of significance. Suffice to say, we do know there is VCR below 95 level, and we need to pursue that once we are in position on 100 level. So that is the simple answer. If you look at the trackless, we are still getting broken grades of around about 7g per ton, and then yielding just on 6g per ton. So that’s the sort of round numbers you can look at. Coming back to the second question on the floor on the cap. This will be finalised during the course of March to May 2009. That is the period from when Mvela can exercise their option. Bear in mind they have still got to be issued with the 15%. That is the first step. And the obviously we have an option to exchange those shares, and Mvela has a right to acquire exchange. So that right has to be

  • exercised. You can run these valuations at different rates and different levels, and if you take into account a market-related adjustment

to all of these things, that’s the main reason it has gone the way it has gone. And that is all we’re really doing here. We are saying, what is essentially the market-related value of the interest that could be swapped in exchange for the issue of new shares? And given the movement in the share price that has resulted in this valuation going this way. Now last quarter the valuation was a positive R32

  • million. So you can see the change in the share price has brought it down. So this thing is going to be volatile. It is going to be up and

down in our income statement, but we’re not going to know the final result and the final impact until we do the exchange. This is one of the issues of modern accounting practises where you have to mark to market all of these things and put them through the income

  • statement. And I know its not easy to understand why these things come out the way they do, but trust me we have put it through four

black boxes to make sure we got the same answer. We go to Dave now, and after Dave to Ruby behind you. Thank you very much. David Hall from Macquarie. I have three questions. First is on the cash flow. You talk about R1.1 billion cash flow from operations Nick. You cap ex for the moment is $2.4 billion at this quarter, but you talked about the two projects that are

  • disappearing. But even after they disappear you’ve still got $1.6 billion a quarter. I mean that doesn’t seem like a very good equation

to me. That’s the first question. The second question is on the power outages. You talk about 21% off your production going forward. We’ve had no mention yet about job losses. On the cost savings it’s amazing to me you’re not looking at reducing your footprint and reducing your costs significantly. I mean this is going to be a massive negative move on your unit costs in South Africa. Could you address that? And then third question: you talked about 600 megawatts of power used. Harmony talks about 500 megawatts. Anglo Gold talks about 400 megawatts. Could you explain why you are 50% higher than Anglo Gold? Thank you. Ok shall I deal with the cash flow first? I think as I said in the presentation the cash flow from operations this quarter should have been a lot higher. But we had almost R600 million go out in terms of working capital movements. And also in the previous quarter we had a further R200 million that went out. So to date we’ve had almost R800 million of negative working capital movements. And based on what we’ve seen in the past and based on my forecasts that I’ve looked at, I’m pretty confident that we’re going to reverse a lot of that. So a lot of that is going to come back. First of all I think R1.1 billion isn’t a steady-state base that you should use to work out cash from

  • perations. Your figures are right. When the main projects come out we’re still going to be spending a lot of money. But at the same

time if you factor in what I’ve just mentioned, cash flow from operations should increase with the working capital swing. And in addition, if you factor in the current prices we should be more than able to cover the remaining capital and generate some surplus

  • cash. But we are going to have a period of high capital in this next quarter. The next quarter’s capital is probably going to be roughly

the same as what we have had this quarter. So we’re only going to see those kinds of benefits in the second half do the year. And then super-imposed on top of that, as you heard John say, Cerro Corona is coming in during the second half of the year with a very steep build-up to full production. And if these prices hold up for copper and for gold then we’re going to have that coming in. And bear in mind, if you look at what is happening at the moment, we are spending substantial capital on Cerro Corona. So it’s not just cessation of the capital; it is the capital disappearing down to ongoing capital to generate very substantial cash flow. And the ongoing capital on this project I think is in the order of $10 million to $15 million a year. So that is where we’re headed in terms of the overall financial position, all other things being equal. David on the power situation, what we have been asked by Eskom is to look at our average consumption between October 2006 and September 2007. So that is the average demand, and you look across operations. And we consumed 598 megawatts. So as to the differences between Anglo and Harmony, everyone is working off that decree by Eskom. That is the basis upon which they are going to work. Obviously the power usage is different in terms of depth and complexity of mine. To do a simple description of why one is 500 megawatts and one is 600 megawatts, I don’t think we can do that. But suffice to say we are getting 600 megawatts and we are going to get 90% of that, which is 540 megawatts. Moving to your second question, I think it is premature to talk about job cuts. In the first instance what we’ve got to do is get a definitive electricity supply. I’d like to know that we are going to get the 90%. I don’t know that is guaranteed and in the bag. Once we are in that situation you can then start making decisions. Suffice to say we are running scenarios

  • n 80% and we are running scenarios on 90%. We need to evaluate all of that in terms of that slide that I showed a little earlier, and

look at detailed planning as far as footprint is concerned. What do we stop, what do we turn off, what is the impact? And then on top

  • f that, as Ian alluded to a little earlier, we need to also look at it in terms of a portfolio perspective. In other words, do we take power

from one mine and give to another? We could make decisions like let’s stop one mine and get the whole of Driefontein and Kloof

  • running. That is the scenario. We need to look at all those and how it pans out and what the best return for our shareholders is. And
  • nce we have complete that work we will articulate it. We will have to come back to the market and say what we’re going to do.

Thank you. Based on statements by various Eskom spokesmen, it is clear that we’re going to have a power problem for as long as six years into the future. And consequently an awful lot of thought needs to go into not only how savings can be had, but whether or not you can supplement power supply. I don’t have a head for these things, but for instance by generation of your own power. Now the passing of a dividend in a perfect world means that in this quarter already means that you have between R600 million and R700

slide-22
SLIDE 22

million that you would have paid out as a dividend. So that is something that you could utilise immediately to supplement power

  • generation. I accept that it is early days for you to have gone through all the options available, but has any thought been given to this

particular aspect? Next, leading from the previous gentleman’s question about staff, your report does state that the 10% reduction by Eskom will impact on gold production and may regrettably lead to shaft closures and restructuring. By that I take it you may have to resort to dismissals. Is that correct? Do I read it correctly? And finally, is there anything in your wage contracts that allows you to pay staff for any prolonged cessation of production through no fault of your own? Ok, if I could possible answer the first question on co-generation of power. One of the aspects of Eskom’s strategy was to look for co- generation, and they asked for industry in this country to submit. They have submissions which total something like 5 gigawatt. They are evaluating that. Gold Fields has submitted two: one for the Free State and one for the Kloof mine. We are waiting adjudication on that to see if they would be passable in their eye, and then we would look at some sort of mechanism in terms of that co-generation. But just to give you an idea, were we to co-generate in the Free State where we have methane and we actually utilise that to co- generate power, the numbers are actually relatively low. We could co-generate to something like 10 or 20 megawatt. But bear in mind that we need orders of magnitude, higher numbers, to operate our mines. But every bit will help, so we’re waiting to hear from Eskom

  • n the success of that. I think the other thing that needs to be said is that we are investing in additional emergency power. We’re going

to spend in excess of R150 million to secure our assets for a total blackout over 24 hours. Those orders have been put in and that is something that we had seen last year as a possible outcome. So that is on the emergency side. Anything could happen. I mean, if you are to reduce production, obviously there could be job cuts. But the first thing for us to do is see what energy saving we can do. And again I go back to if Eskom can guarantee us 90% it is better than them guaranteeing us 80%, because it is only 10% to cut. So we’ve got to look at energy efficiency in the first instance. And then once we’re in that situation and we have decided on the scenarios, yes there may be job cuts. But then it would be a matter of negotiation with the organised labour. The other part of this equation is how long is this piece of string? How long is the 90% going to last for? We can do all sorts of imaginative things and innovative things with labour in terms of leaves and payment and unpaid leave. All of that can be done, but again it depends on how long it is going to last for. At some stage you would probably have to make some sort of decisive change to the structure of the organisation. The last question that you asked, there is nothing in the contracts we have with labour that would permit us not to pay them for no fault

  • f ourselves. People are being paid.

Ladies and gentlemen, thank you very much. We have overrun considerably so lets wrap it up here. If you’ve got any further questions please approach any one of the management team or contact me afterwards and we can set up an interview for you with who ever you want to speak to. I invite the press people to go next door for the press interview straightaway please, and the rest of you please join us for lunch in the adjoining room out to the left. Thank you very much.