
SLIDE 1
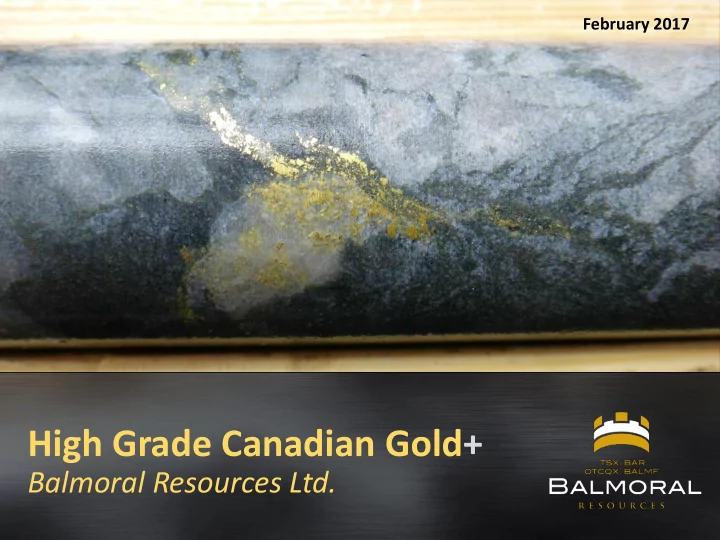
High Grade Canadian Gold+
Balmoral Resources Ltd.
February 2017
High Grade Canadian Gold+ Balmoral Resources Ltd. This - - PowerPoint PPT Presentation
February 2017 High Grade Canadian Gold+ Balmoral Resources Ltd. This presentation is prepared by Balmoral Resources Ltd. (Balmoral or This presentation may also refers to historic geological resources BAR) management and BAR
February 2017
BAR”) management and BAR is solely responsible for content and format. Darin W. Wagner, P.Geo is a non-independent Qualified Person and has compiled this presentation from publicly available industry information, NI43-101 compliant technical reports and new releases with specific underlying Qualified Persons as set out in the releases and reports. Industry Information has been compiled from publicly available sources and may not be complete, up to date or reliable. Forward looking statements may differ materially from actual events. Please see complete information on SEDAR (www.sedar.com).
Registered Investment Representative prior to making any investment
company’s projects up to February 27, 2016 and provides a guide to the company’s potential future activities and use of funds. There can be no assurance that the company objectives will be achieved.
Commission does not recognize the reporting of Inferred Resources. These resources are reported under Canadian National Instrument 43- 101 and have a great amount of uncertainty and risk as to their existence and economic and legal feasibility. It cannot be assumed that all or any part of Inferred Resources will ever be upgraded to a higher category. Under Canadian Rules estimates of Inferred Mineral Resources may not form the sole basis of feasibility studies or pre-feasibility studies. INVESTORS ARE CAUTIONED NOT TO ASSUME THAT PART OR ALL OF AN INFERRED RESOURCE EXISTS, OR ARE ECONOMICALLY OR LEGALLY MINEABLE.
identified by an asterik * in the text – these resources are historic in nature and pre-date the implementation of Canadian National Instrument 43-101. Neither the Canadian nor the US Securities and Exchange Commission recognize the reporting of historic resources they are considered conceptual in nature. It cannot be assumed that all
ALL OF GEOLOGICAL RESOURCES EXISTS, OR ARE ECONOMICALLY OR LEGALLY MINEABLE. They are included herein solely for historic context and completeness.
accuracy or adequacy of this presentation, which has been prepared by
the resource estimates will be supported by a Pre-feasibility or Feasibility Study or that any forward looking event will come to pass. The data is incomplete and considerable additional work will be required to complete further evaluation, including but not limited to drilling, engineering and socio-economic studies and investment.
similar mineral properties in respect of which the Company has no interest or rights to explore or mine. Readers are cautioned that the Company has no interest in or right to acquire any interest in any such properties, and that mineral deposits on adjacent or similar properties are not indicative of mineral deposits on the Company’s properties. Past performance is no guarantee of future performance and all investors are urged to consult their investment professionals before making an investment decision. Investors are further cautioned that past performance is no guarantee of future performance
2
Darin Wagner – President, CEO and Director – M. Sc., P. Geo. Founder of Balmoral and Co-Founder, President and CEO, West Timmins Mining sold to Lakeshore Gold for $424 Million; veteran geologist with 25 years of international experience with major and junior companies including Noranda, Cominco, PTM, MAG,NCA,FPC Richard Mann – Vice-President, Exploration Experienced explorationist and project manager; 15 years of intl. experience with Barrick, Miramar and Cominco.; manages award winning exploration team Dan MacInnis – Lead Director – P. Geo. Over 40 years worldwide exploration experience including leading one
Graeme Currie– Director – Industry Analyst and Investment Banker Over 30 years experience analyzing and evaluating exploration and mining companies for one of Canada’s largest brokerage houses. Currently serving as Chairman of Pure Gold mining. Larry Talbot – Director – Legal Counsel Respected legal counsel with over 25 years of related industry experience; extensive background as a director with publicly listed companies Bryan Disher – Director – (CPA, CA) 38 years with PricewaterhouseCoopers in Canada, Australia and
term as Chair of the Board. Peggy Wu – Chief Financial Officer – CPA Chartered Accountant and Financial reporting specialist with extensive experience with publicly listed resource companies. John Foulkes – Vice President, Corporate Development Experienced and successful explorationist with 20 years of industry experience including over 10 years as Manager of Corporate Development for TSX listed resource companies.
3
Trend Project is located in the Abitibi Region of Quebec
largest accumulation of high-grade gold deposits on earth and numerous significant copper, nickel and zinc deposits
Abitibi occur along major, regional scale faults, like the Sunday Lake & Lower Detour Deformation Zones underlying Balmoral’s holdings. These deposits are renowned for their tremendous vertical continuity and high average gold grades
square kilometres of mineral rights
4
complexes
within the James Bay Settlement Agreement area
5
6
The Abitibi and Canada in general continue to be the principal focus of M&A in the gold space with several high-profile acquisitions delivering value to investors
High-grade gold mineralization from the Bug North Footwall Zone on the Martiniere Property This sample returned 9,710 g/t gold over 0.57 metres – highest grade sample on Detour Trend
7
8
surface mineralized zones; 5 new shallow discoveries in 2016 including:
depth/down plunge
delineation and expansion of the Bug South deposit
9
Cross-Sections
deposits: Bug North Bug South Martiniere West Bug Lower Steep
additional near surface mineralized zones
metre drill program currently underway with results pending
13
14
Bug North Deposit (SE plunge) Lower Steep Target Zone
Upper Bug Lower Bug Hanging Wall Zone
Martiniere East Porphyry (MEP) Target
Footwall
50 m Cross Section Looking North
200 m vertical
W E Deepest Hole Now 540 Vertical Metres – Open to Depth !
zones which comprise the Bug North Deposit
1,138 g/t gold over 4.87 m 273 g/t gold over 3.88 m 197 g/t gold over 0.83 m 35.15 g/t gold over 4.15 m 27.05 g/t gold over 6.22 m 22.89 g/t gold over 4.10 m 21.60 g/t gold over 6.30 m 19.55g/t gold over 44.45 m 11.17 g/t gold over 10.99 m 9.30 g/t gold over 15.75 m 9.05 g/t gold over 7.60 m 7.94 g/t gold over 19.70 m
holes have returned intercepts of >10 g/t gold!
15
Martiniere Gold System
spans at least 4 x 2 kilometres and is
gold mine and a similar distance north of the Casa Berardi gold mine
300 vertical metres
depth/down plunge
16
17
Martiniere
4.06 g/t 3.75 g/t
This presentation contains information with respect to adjacent or similar mineral properties in respect of which the Company has no interest or rights to explore or mine. Readers are cautioned that the Company has no interest in or right to acquire any interest in any such properties, and that mineral deposits on adjacent or similar properties are not indicative of mineral deposits on the Company’s properties. Past performance is no guarantee of future performance and all investors are urged to consult their investment professionals before making an investment decision. Investors are further cautioned that past performance is no guarantee of future performance
18
1180 m Level
19
20
NEW 200 g/t gold discovery Grasset Au Discovery – 4.5 g/t over 6.0 m Numerous Gold Zones Proximal to H3 and H1 Ni- Cu-Co-PGE deposits NEW Lac du Doigt gold discoveries; multiple parallel gold zones - open ended, over 5.0 km long target zone Winter 2016 IP reveals multiple targets for drill testing
QC ON
58N
21
including 1.6 m @ 5.53 g/t gold from the down-plunge extension of the Lynx Gold Zone
22
Metallurgy
Infrastructure
Jurisdiction
Exploration Potential
Nations Partners
Owned, No Royalties
23
The nickel sulphide world faces a lack of assets going forward; Grasset represents a large, quality asset well positioned for the coming turn in nickel prices Au
Au
24 Base Case Resource Estimate - Published May 7, 2016
> 1.00 % NiEq
Tonnes NiEq Ni Cu Co Pt Pd Contained NiEq Contained Ni Contained Cu Contained Co Contained Pt Contained Pd
(t) (%) (%) (%) (%) (g/t) (g/t) (lbs) (lbs) (lbs) (lbs) (oz) (oz) INDICATED Horizon 1 35,900 1.09 0.98 0.11 0.03 0.16 0.38 865,800 772,600 84,100 22,700 200 400 Horizon 3 3,416,600 1.80 1.57 0.17 0.03 0.34 0.85 135,413,200 118,316,800 13,148,000 2,317,600 37,700 93,000 Total Indicated 3,452,500 1.79 1.56 0.17 0.03 0.34 0.84 136,279,000 119,089,400 13,232,100 2,340,300 37,900 93,400 INFERRED Horizon 1 4,700 1.08 0.96 0.11 0.03 0.17 0.39 111,500 99,400 11,700 3,100 100 100 Horizon 3 86,400 1.20 1.06 0.11 0.02 0.20 0.48 2,282,400 2,027,600 217,100 45,900 600 1,300 Total Inferred 91,100 1.19 1.06 0.11 0.02 0.20 0.48 2,393,900 2,126,900 228,700 49,000 600 1,400
99% of Base Case Resource Hosted by H3 Zone 97.5% of Base Case Resource in Indicated Category
* See information on last page of this presentation
25
Resource Class Cut-off (NiEq %) Tonnes Ni Equivalent (%) Ni % Cu % Co % Pt g/t Pd g/t Contained Ni EQ (lbs) Indicated
> 0.50 9,434,000 1.09 0.96 0.10 0.02 0.20 0.49 226,557,400
Inferred
> 0.50 788,700 0.69 0.62 0.07 0.02 0.11 0.26 12,029,700
Potential for significant increase in mineable tonnage within minor decrease in grade vs. current base case; significant leverage to increasing nickel prices
Base Case
Management and Insiders 4% Institutional Investors (31) 15% High Net Worth and Retail Investors 81%
Current Share Ownership Distribution Balmoral Resources Ltd.
Issued and Outstanding
125,499,167
Warrants Options @ $1.05 (expire Feb 2018) Options @ $0.60 (expire Jan 2019) Options @ $0.61 (expire Feb 2019) Options @ $0.90 (expire Dec 2019) Options @ $0.77 (expire June 2020) Options @ $0.60 (expire March 2021) Options @ $0.90 (expire Nov 2021) Options @ $0.70 (expire Dec, 2021) 1,807,700 2,855,000 300,000 150,000 360,000 1,900,000 175,000 350,000 Fully Diluted
133,396,867
Working Capital $10,000,000
Current Price Market Cap $0.80 $100 million 52 Week High $1.23 52 Week Low
$0.47 280,000 120,000
26
27
Resource Estimate Assumptions and Notes: 1. The Independent and Qualified Persons for the Mineral Resource Estimate, as defined by NI 43-101, are Mr. Pierre-Luc Richard, P.Geo., M.Sc., and Mr. Carl Pelletier, P.Geo., B.Sc., both of InnovExplo Inc. The effective date of the Estimate is January 12, 2016 2. These mineral resources are not mineral reserves as they do not have demonstrated economic viability. 3. While the results are presented undiluted and in situ, the reported mineral resources are considered to have reasonable prospects for eventual economic extraction. 4. The estimate includes two (2) mineralized zones (Horizon 1 and Horizon 3). 5. Resources were compiled at NiEq cut-off grades of 0.30%, 0.40%, 0.50%, 0.60%, 0.70%, 0.80%, 0.90%, 1.00%, 1.10%, 1.20%, 1.30%, 1.40%, 1.50%, and 2.00%. The official resource potential is reported at a 1.00% NiEq cut-off grade. 6. Cut-off calculations used: CAD 48.00$ Mining, 6.00$ Maintenance, 10.00$ G&A, 22.00$ Mining for a total of 86.00$ operating costs. A dilution factor of 7.5% was also applied to the cut-
7. *NiEq = [[(NiGrade(%) x NiCR(%) x NiPayable(%) x NiPrice($)) + (CuGrade(%) x CuCR(%) x CuPayable(%) x CuPrice($)) + (CoGrade(%) x CoCR(%) x CoPayable(%) x CoPrice($))] x 2205 + [(PtGrade(g/t) x PtCR(%) x PtPayable(%) x PtPrice($)) + (PdGrade(g/t) x PdCR(%) x PdPayable(%) x PdPrice($))] / 31.1035 - CrPenalty($)] / (NiPayable(%) x NiCR(%) x NiPrice($) x 2205); where CR(%) is a variable concentrate recovery ratio derived from metallurgical balance study, and Payable(%) is applied on concentrates. Note that a minimum deduction of 0.20% Co was applied on concentrate. 8. *NiEq calculations used: USD/CAD exchange rate of 1.14, Nickel price of US$6.56/lbs, Copper price of US$2.97/lbs, Cobalt price of US$13.00/lbs, Platinum price of US$1,302.30/oz, and Palladium price of US$737.20/oz (These are 3-year trailing averages calculated at the effective date); Payable of 70% for Nickel, 75% for Copper, 75% for Cobalt (minimum deduction of 0.20%), 45% for Platinum, and 45% for Palladium applied on expected concentrate based on analysis of available smelting and refining cost parameters 9. Cut-off and NiEq calculations would have to be re-evaluated in light of future prevailing market conditions (metal prices, exchange rate, smelting terms, and mining costs). 10. Density values were estimated for all lithological units from measured samples. Density values for the Horizon 1 and Horizon 3 mineralized zones were interpolated from both a measured density database and a correlation database accounting for a selection of metals (Ni, Fe, Co) yielding the best correlation with the measured database. 11. The resource was estimated using GEMS 6.7. The estimate is based on 111 diamond drill holes (39,999.43 m). A minimum true thickness of 3.0 m was applied, using the grade of the adjacent material when assayed, or a value of zero when not assayed. 12. High grade capping was done on raw assay data and established on a per zone basis for Nickel (15.00%), Copper (5.00%), Platinum (5.00g/t), and Palladium (8.00g/t). Capping grade selection is supported by statistical analysis. 13. Compositing was done on drill hole sections falling within the mineralized zones (composite = 1.0 m). 14. Resources were evaluated from drill holes using a 3-pass ID2 interpolation method in a block model (block size = 5 x 5 x 5 m). 15. The Mineral Resources presented herein are categorized as Indicated and Inferred based on drill spacing, geological and grade continuity. Based on the nature of the mineralization, a maximum distance to the closest composite of 50 m was used for indicated Resources. The average distance to the nearest composite is 22.9 m for the Indicated resources and 53.6 m for the Inferred resources. 16. Ounce (troy) = metric tonnes x grade / 31.10348. Calculations used metric units (metres, tonnes and g/t). Metal contents are presented in ounces and pounds. 17. The number of metric tons was rounded to the nearest hundred. Any discrepancies in the totals are due to rounding effects 18. The quantity and grade of reported Inferred resources in this Mineral Resource Estimate are uncertain in nature and there has been insufficient exploration to define these Inferred resources as Indicated or Measured, and it is uncertain if further exploration will result in upgrading them to these categories. 19. CIM definitions and guidelines for mineral resources have been followed. 20. The Qualified Persons are not aware of any known environmental, permitting, legal, title-related, taxation, socio-political or marketing issues, or any other relevant issue, that could materially affect the Mineral Resource Estimate.
Corporate Office:
Suite 1750 - 700 West Pender St. Vancouver, B.C., Canada V6C 1G8 1.604.638.3664 www.balmoralresources.com
Investor Contact:
1.604.638.5815 1.604.638.3664 North America Toll Free 1.877.838.3664 info@balmoralresources.com
28