
SLIDE 1
1
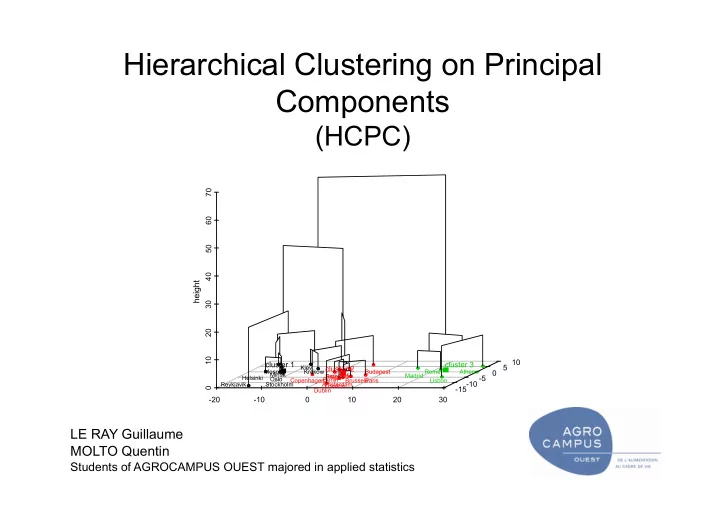
Hierarchical Clustering on Principal Components
(HCPC)
LE RAY Guillaume MOLTO Quentin
Students of AGROCAMPUS OUEST majored in applied statistics
- 20
- 10
10 20 30 10 20 30 40 50 60 70
- 15
- 10
- 5
5 10
height
Moscow Helsinki Minsk Reykjavik Oslo Stockholm Kiev Krakow Copenhagen Prague Berlin Sarajevo Sofia Dublin London Amsterdam Budapest Brussels Paris Madrid Rome Lisbon Athens
cluster 1 cluster 2 cluster 3