
SLIDE 1
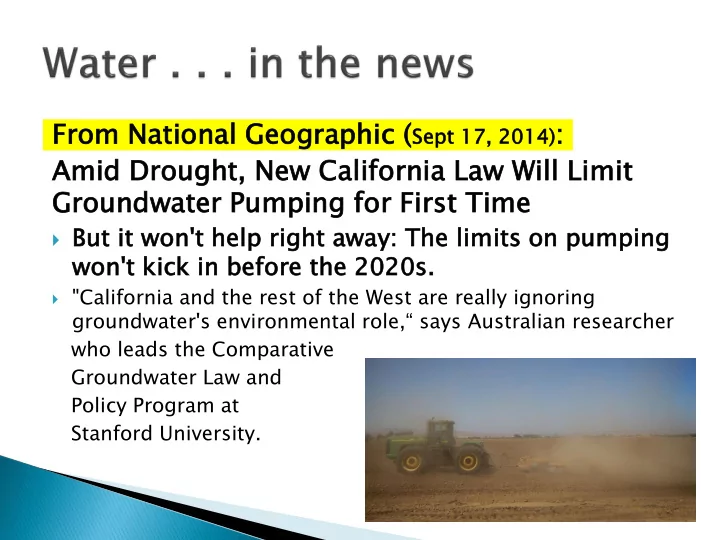
From m Na National nal Geo eographic graphic (Sep
ept 17, , 2014) 014):
: Amid Droug
- ught,
ht, New w California
- rnia Law
w Wi Will Limit Ground
- undwater
water Pu Pumpin ping g for First st Time
But it won't
't hel elp right ht aw away ay: Th The e limits ts on pumping mping won't 't kick ck in before
- re the 20
2020 20s.
"California and the rest of the West are really ignoring
groundwater's environmental role,“ says Australian researcher who leads the Comparative Groundwater Law and Policy Program at Stanford University.