
SLIDE 1
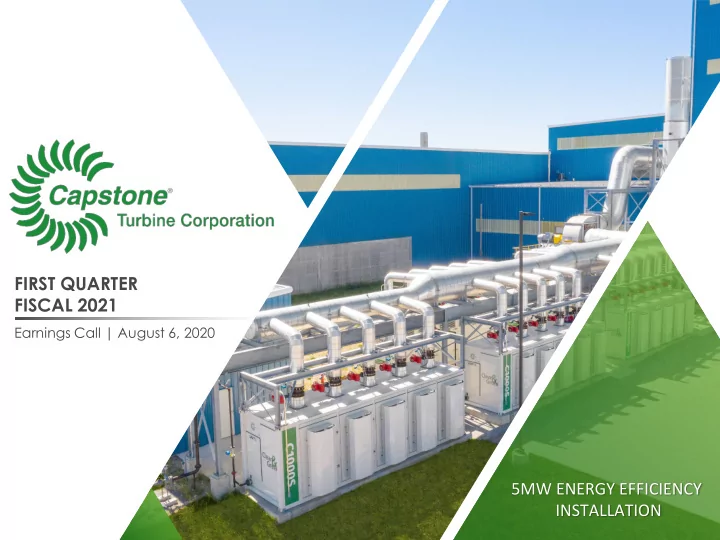
FIRST QUARTER FISCAL 2021
Earnings Call | August 6, 2020
5MW ENERGY EFFICIENCY INSTALLATION
FIRST QUARTER FISCAL 2021 Earnings Call | August 6, 2020 5MW - - PowerPoint PPT Presentation
FIRST QUARTER FISCAL 2021 Earnings Call | August 6, 2020 5MW ENERGY EFFICIENCY INSTALLATION Safe Harbor This presentation contains forward-looking statements within the meaning of the safe harbor provisions of the Private
FIRST QUARTER FISCAL 2021
Earnings Call | August 6, 2020
5MW ENERGY EFFICIENCY INSTALLATION
This presentation contains “forward-looking statements” within the meaning of the “safe harbor” provisions of the Private Securities Litigation Reform Act of 1995, including but not limited to, statements regarding the financial outlook, business strategy and plans and market trends, opportunities and positioning of Capstone Turbine Corporation (the “Company,” “Capstone,” “we,” “our” or “us”). These forward-looking statements are based on current expectations, estimates, forecasts and projections. Words such as “expect,” “anticipate,” “should,” “believe,” “hope,” “target,” “project,” “goals,” “estimate,” “potential,” “predict,” “may,” “will,” “might,” “could,” “intend,” “shall” and variations of these terms and similar expressions are intended to identify these forward-looking statements, although not all forward-looking statements contain these identifying words. Forward-looking statements are subject to a number of risks and uncertainties, many of which involve factors
projected include, but are not limited to: the impact of the COVID-19 pandemic on our business, results of
to effectively introduce and market new products; delays in product introductions; significant competition; inability to further penetrate our current customer base, expand our user base and increase the frequency of use of our products by our customers; inability to achieve or maintain satisfactory pricing and margins; manufacturing difficulties; product defects or failures; potential adverse regulatory actions, and general market, political, economic and business conditions. Further information on these and other factors that could affect the Company's financial results is included in the reports on Form 10-K, Quarterly Reports on Form 10-Q and other periodic filings with the Securities and Exchange Commission from time to time. Because of the risks and uncertainties, Capstone cautions you not to place undue reliance on these statements, which speak only as of the date of this presentation. There may be additional risks of which we are not presently aware or that we currently believe are immaterial which could have an adverse impact on our business. We undertake no obligation, and specifically disclaim any obligation, to release any revision to any forward-looking statements to reflect events or circumstances after the date of this presentation or to reflect the occurrence of unanticipated events.
2
Nasdaq: CPST Darren Jamison
PHASE 1
delaying all non-essential product development
current 8.6MW up to 10 MW with 85% utilization
newly upgraded United Kingdom Integrated Remanufacturing Facility (IRF)
PHASE 2
attachment rates from 38% to 45%
backlog and revenue growth
business for Capstone
Adjusted Positive EBITDA Goal Achieved in Q1 as Forecasted
4
“We achieved our stated goal of positive adjusted EBITDA for the quarter ended June 30th despite the impacts of COVID-19. The results represent a $5.1M improvement compared to the March quarter and $3.5M improvement year-over-year. These tremendous improvements are driven by the work we put into lowering our
product shipments.” Darren Jamison – Capstone CEO Adjusted Positive EBITDA Goal Achieved Despite COVID-19 Impacts
5
6
Y/Y Improvement Quarter-To-Date
Nasdaq: CPST
Eric Hencken
million in Q4 FY2020.
Distributor Support System (DSS) revenue was $8.1 million, up 4% from $7.8 million in Q4 FY2020.
FY2021 compared to $8.0 million in Q4 FY2020 and decreased $9.0 million, or 64%, compared to $14.1 million in Q1 FY2020, supporting improved liquidity and positioning the Company for positive working capital in the upcoming quarter.
increase of $1.1 million, compared to $15.1 million as of March 31, 2020, despite
Q1 FY2021.
Company focused on liquidity as part of its COVID-19 Business Continuity Plan.
8
(In millions)
Q1 FY21 Q4 FY20
Microturbine Product $6.1 $3.8 Accessories, Parts & Service $8.1 $7.8 Total Revenue $14.2 $11.6 Gross Margin $3.4 $0.5 Gross Margin Percent
24% 4%
R&D Expenses $0.4 $0.8 SG&A Expenses $3.5 $5.2 Total Operating Expenses $3.9 $6.0 Net Loss $(1.8) $(6.9) Adjusted EBITDA* $0.1 $(5.0)
*See Appendix, Slide 23
9
(In millions) June 30, 2020 March 31, 2020 Cash & Cash Equivalents $16.2 $15.1 Cash Used in Operating Activities $1.9 $4.0 Accounts Receivable, Net of Allowances $14.7 $16.2 Total Inventories $19.2 $22.7 Accounts Payable & Accrued Expenses $10.8 $15.0
$30M Goldman Sachs 3-Year Term Note Increases Financial Flexibility
10
(In millions)
Q1 FY21 Q1 FY20
Microturbine Product $6.1 $10.1 Accessories, Parts & Service $8.1 $9.1 Total Revenue $14.2 $19.2 Gross Margin $3.4 $2.9 Gross Margin Percent
24% 15%
R&D Expenses $0.4 $0.9 SG&A Expenses $3.5 $6.2 Total Operating Expenses $3.9 $7.1 Net Loss $(1.8) $(5.6) Adjusted EBITDA* $0.1 $(3.4)
*See Appendix, Slide 23
11
Nasdaq: CPST Darren Jamison
Employee Health and Safety Business Continuity for Essential End Use Customers Increase Liquidity and Improve Working Capital Positive Adjusted EBITDA in June Quarter
13
O f Y / Y A d j . E B I T D A I m p r o v e m e n t
"The pandemic has undeniably been challenging, but it did afford us a unique opportunity to thoroughly reevaluate every aspect of our strategic business plan and make the tough, but necessary, adaptations so that we were able to support our long- term goals, and most importantly we have an opportunity to emerge from this global crisis as a stronger and more resilient business than before."
D I R E C E C T S A L E S E S
R E N T A L A L S
G R O R O S S M M A R G R G I N
I N V N V E N T O R Y R Y T U R N S R N S
Guidance Subject to Change Based on Future Economic Developments
14
15
Focus On Reducing Cost Low Cost Natural Gas Microgrid Adoption Gas Flaring Regulations New Engine Emissions Green Building (LEED) Severe Weather Crude Oil Prices Federal & State Subsidies Electrification
Positive Neutral Negative
16
Direct Sales, National Accounts, Expanded Product Portfolio on New Fuels, Strategic Partnerships, Rentals, OEM like 24/7 Solar, B+K Expanded Distribution in New Geographies like Eastern Europe, Africa and the Middle East New Digital Marketing Strategy, Website Update, Customized Campaigns Targeted by Market, IndyCar Branding Strategy. Maximize B2B and Marketing IRR Implementation of Target Pricing Programs for Key National Accounts, OEMs with Existing Capstone Installations New RNG and Hydrogen Product Released with a goal of Operating on 100% Hydrogen in 18 months Improving C200/C1000 Product Performance with New Parts Suppliers. Replacing Legacy Supplier with Poor Manufacturing
Reliability, Lower Warranty and FPP Costs.
GROWTH STRATEGY
New Marketing Strategy New Non- Distributor Business Target Pricing Program Distributor Business Growth Improved Customer Satisfaction New RNG & Hydrogen Products
H Y D R O G E N
17
Capstone now offers renewable power with the use of up to 20% Hydrogen in our product line of microturbines as a fuel
hydrogen and a newly patented injector. New Patent 10,184,664, is for a multiple-fuel capable, pre-mixed, low emission injector for high flame speed fuel combustion for Hydrogen and Renewable Natural Gas (RNG). Plans are in place to release a commercial 100% hydrogen fuel capable microturbine over the next couple of years.
H Y D R O G E N
Nasdaq: CPST
Nasdaq: CPST
“Our preliminary financial results show us on track to achieving our goal of positive adjusted EBITDA for the June quarter. While we will not have final results until our books are closed and our financial review completed, the preliminary results indicate a significant improvement when compared to the fourth quarter that ended on March 31, 2020 and the first quarter of fiscal 2020 that ended on June 30, 2019. The improvements are being driven by the work we have put into lowering our operating expenses, in combination with improving aftermarket service margins and a small rebound in product shipments versus the fiscal 2020 fourth quarter.” Darren Jamison – Capstone CEO
30-40% of Population is the First Generation to Have Grown Up With Climate Change
20
SOCIAL
employees to volunteer work in the local community and routinely conducts annual toy, book, and blood donation drives.
employee events, ranging from health & fitness activities, team building events, social events and celebrations.
education program that is free and open to all employees.
zero waste facility, eliminate all lost time injuries, and reduce near miss accidents. GOVERNANCE
comprised of 3 women and 4 men, with a female Chairperson and Audit Committee lead.
directors who are free of any conflicts of interest and had no prior relationship with the President & CEO.
director education and management transparency.
board “refresh” and each director is up for election annually.
Increasing focus on Environmental, Social and Governance (ESG), principals, regulations and government policies is creating a strong tailwinds for the renewable energy sector globally. There's growing investor interest with ESG investing estimated to be over $20 trillion in AUM as investors demand corporate responsibility.
ENVIRONMENTAL
power systems that allow customers to lower both NOx and CO2 emissions without the use of exhaust after treatment that use precious metals and urea.
carbon savings while also saving $219 million in energy costs.
with new renewable fuels (hydrogen and methanol), allowing customers to generate power with a net-zero carbon footprint.
cleaner and “greener” power solutions that reduce methane emissions while utilizing associated gas that would otherwise be flared into the atmosphere.
the U.S. DOE CHP Technical Assistance Partnership. 21
Capstone Beats Average in All Areas Except Cash & Revenue With Lower Market Cap
(1) Years since incorporation or first initial public offering (2) Source: Nasdaq as of July 30, 2020 (3) Cash, cash equivalents and restricted cash (4) Source: Capstone Turbine Corporation's August 2020 Form 10-Q filing (5) Source: American Superconductor Corporation's June 2020 Form 10-K filing (6) Source: Ballard Power Systems May 2020 Form 10-Q filing (7) Source: FuelCell Energy’s June 2020 Form 10-Q filing (8) Source: Plug Power, Inc. May 2020 Form 10-Q filing $14.2 18.1 18.9 $3.4 2.5 0.2 24.0% 13.8% 0.9% $0.14 0.07 $45.9 215.4 449.0 $16.2 24.7 77.2 $1.1 (0.8) (9.2)
Selected Public Companies
($ in millions)
Financial Statistics Market Statistics Company
Capstone Turbine Corporation (4) Small-Cap Distribution Generation American Superconductor Corp.(5) Plug Power, Inc.(8)
Gross Margin GM % OPEX EBITDA Market Cap
(2)
Cash
(3)
Q/Q in Cash
FuelCell Energy(7)
Revenue Per Employee
$3.9 8.7 8.3 $0.1 (5.1) (3.3)
24.0 5.2 21.7% 3,534.0 181.6 33.8 Ballard Power Systems(6) 15.7 (9.1)
Revenue IPO
(1)
32 33 28 23 12 24
22
40.8 (4.5) (11.0%) 21.4 (6.1) 2,647.0 131.1 (63.2) $25.5 6.3% $13.5 $1,711.4 $93.7 ($9.9) 0.03 0.06 0.06 $0.06 ($5.9) $0.9
23
To supplement the Company’s unaudited financial data presented on a generally accepted accounting principles (GAAP) basis, management has used EBITDA and Adjusted EBITDA, non-GAAP measures. These non-GAAP measures are among the indicators management uses as a basis for evaluating the Company’s financial performance as well as for forecasting future periods. Management establishes performance targets, annual budgets and makes operating decisions based in part upon these metrics. Accordingly, disclosure of these non-GAAP measures provides investors with the same information that management uses to understand the Company’s economic performance year-over-
GAAP. EBITDA is defined as net income before interest, provision for income taxes, depreciation and amortization expense. Adjusted EBITDA is defined as EBITDA before stock-based compensation and other expense, restructuring charges, leadership incentive program, the change in warrant valuation and warrant issuance expenses. Stock-based compensation and other expense includes expense related to stock issued to employees, directors, and vendors. Restructuring charges includes facility consolidation costs and
and should not be considered as an alternative to net income or any other performance measure derived in accordance with GAAP, or as an alternative to cash flows from
While management believes that the non-GAAP financial measures provide useful supplemental information to investors, there are limitations associated with the use of these
differences in the exact method of calculation. Management compensates for these limitations by relying primarily on the company’s GAAP results and by using EBITDA and Adjusted EBITDA only supplementally and by reviewing the reconciliations of the non-GAAP financial measures to their most comparable GAAP financial measures. Non-GAAP financial measures are not in accordance with, or an alternative for, generally accepted accounting principles in the United States. The Company’s non-GAAP financial measures are not meant to be considered in isolation or as a substitute for comparable GAAP financial measures, and should be read only in conjunction with the Company’s consolidated financial statements prepared in accordance with GAAP. Reconciliation of Reported Net Loss to EBITDA and Adjusted EBITDA (in thousands) Three months ended Three months ended March 31, June 30, 2020 2020 2019 Net loss, as reported $ (6,950) $ (1,823) $ (5,593) Interest expense 1,345 1,291 1,276 Provision for income taxes 4 1 8 Depreciation and amortization 392 354 373 EBITDA (5,209) (177) (3,936) Stock-based compensation and other expense 244 298 262 Restructuring charges — — 300 Adjusted EBITDA $ (4,965) $ 121 $ (3,374)
16640 Stagg Street, Van Nuys, CA 91406 USA - Tel: 818.734.5300, Toll Free: 866.422.7786 CAPAug2020
Nasdaq: CPST
twitter.com/CapstoneTurbine linkedin.com/company/34302/ youtube.com/CapstoneTurbine Follow Darren Jamison, CEO Follow Capstone Follow Capstone Follow Capstone Follow Capstone Follow Darren Jamison, CEO @capstoneturbine @darrenjamison_cpst https://www.facebook.com/capstoneturbine/ Follow Capstone twitter.com/darren_jamison