
SLIDE 1
PREVENIRE LA CELIACHIA ?
CASERTA 19 MAGGIO 2012 luigi greco
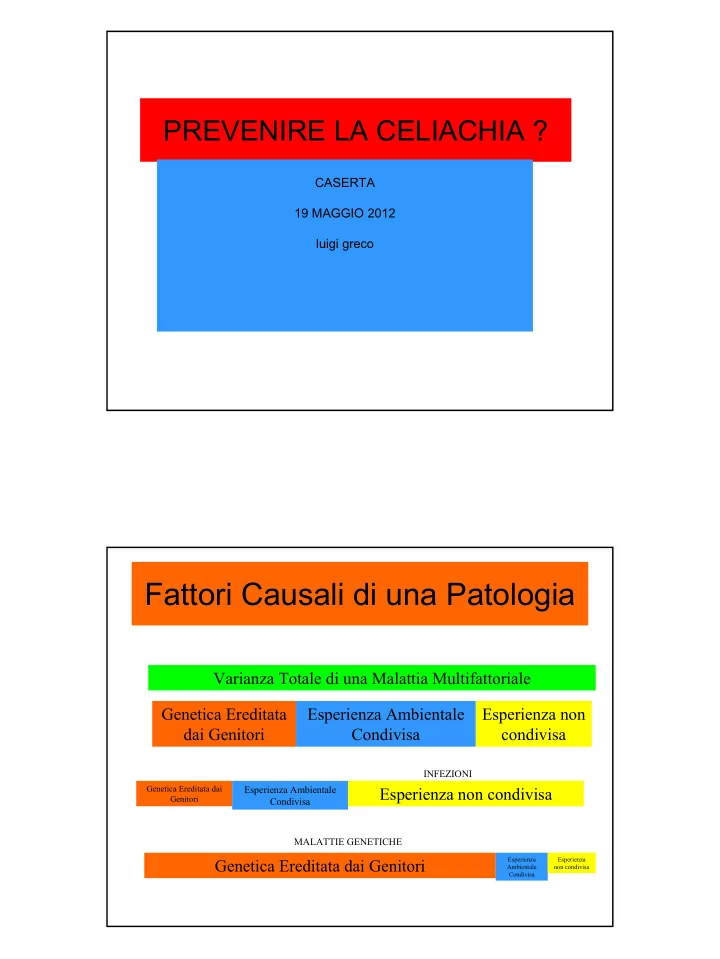
Fattori Causali di una Patologia
Varianza Totale di una Malattia Multifattoriale Genetica Ereditata dai Genitori Esperienza Ambientale Condivisa Esperienza non condivisa
Genetica Ereditata dai Genitori
Esperienza Ambientale Condivisa
Esperienza non condivisa Genetica Ereditata dai Genitori
Esperienza Ambientale Condivisa Esperienza non condivisa
INFEZIONI MALATTIE GENETICHE