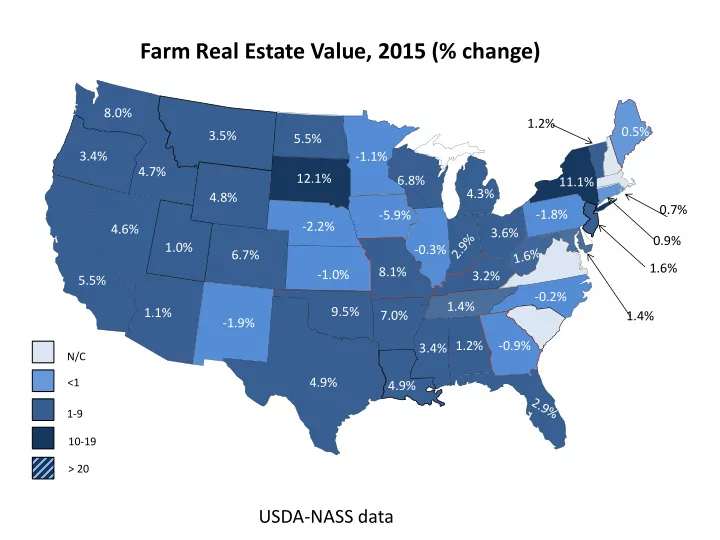

Farm Real Estate Value, 2015 (% change) 8.0% 1.2% 0.5% 3.5% 5.5% 3.4% -1.1% 4.7% 12.1% 6.8% 11.1% 4.3% 4.8% 0.7% -5.9% -1.8% -2.2% 4.6% 3.6% 0.9% 1.0% -0.3% 6.7% 1.6% 8.1% -1.0% 3.2% 5.5% -0.2% 1.4% 9.5% 1.1% 7.0% 1.4% -1.9% 1.2% -0.9% 3.4% N/C 4.9% <1 4.9% 1-9 10-19 > 20 USDA-NASS data
Cropland Average Value by State, 2015 ($ per acre) 2,630 997 2,140 4,750 2,600 4,600 3,200 3,730 2,600 4,550 1,370 8,200 5,900 13,500 2,670 5,070 5,850 7,950 7,000 7,650 3,300 1,910 4,440 2,210 3,720 6,470 3,810 10,690 4,100 3,470 1,620 2,630 2,460 8,320 1,440 2,620 2,850 3,160 N/A 1,840 2,500 6,560 500 - 999 1,000 – 2,499 2,500 – 4,999 5,000 – 15,000 USDA/NASS data
Cropland Value, 2015 (% change) 2.7% 1.0% 4.4% 4.0% -2.5% 5.3% 8.7% 5.7% 2.8% 1.1% 4.8% 1.0% -6.3% -2.1% 4.6% 3.5% 1.2% -0.6% 3.8% -0.4% 3.8% 8.1% -2.2% 4.8% 5.4% 0.9% -2.4% 8.0% 2.1% 1.1% 3.5% -0.7% $1620 N/A 1.2% 2.6% 1.9% N/C 9.5% <1 5.0% 1-9 >10 USDA-NASS data
Oklahoma Non-Irrigated Cropland Value Trend 1,800 1,600 1,400 1,200 1,000 800 600 400 200 - 1970 1973 1976 1979 1982 1985 1988 1991 1994 1997 2000 2003 2006 2009 2012 2015 non-irrig cropland price Linear (non-irrig cropland price) USDA/NASS
Capitalized Values: Oklahoma Non-Irrigated Cropland 2,000 1,800 1,600 1,400 1,200 1,000 800 600 400 200 - 1970 1973 1976 1979 1982 1985 1988 1991 1994 1997 2000 2003 2006 2009 2012 2015 non-irrig cropland price capitalized cropland value USDA/NASS + 10 year t-note
Pasture Land Average Value by State, 2015 ($ per acre) 820 650 850 660 1,900 1,250 2,500 980 1,430 2,680 510 2,850 3,400 870 3,140 3,550 13,500 1,050 760 2,700 4,050 1,390 1,950 6,000 2,750 4,700 3,500 940 1,420 2,290 340 2,940 2,140 2,140 3,580 1,600 N/A 2,590 300 - 999 1,000 – 2,499 2,500 – 4,999 5,000 – 15,000 USDA/NASS data
Pasture Value, 2015 (% change) 1.2% 1.6% 13.3% 4.8% 18.8% 2.5% 14.0% 16.3% 7.5% 7.2% 4.1% -5.9% -1.7% -3.3% 1.3% 1.0% 4.4% 6.7% 3.1% 5.4% 6.9% 1.9% 5.5% -1.3% 4.4% 2.9% 2.2% -5.6% $1420 N/A 1.4% 1.9% -1.9% 1.4% N/C 1.3% <1 3.6% 1-9 >10 USDA-NASS data
Oklahoma Pastureland Value Trend 1,600 1,400 1,200 1,000 800 600 400 200 - 1970 1973 1976 1979 1982 1985 1988 1991 1994 1997 2000 2003 2006 2009 2012 2015 pasture price Linear (pasture price) USDA/NASS
Capitalized Values: Oklahoma Pastureland 1,600 1,400 1,200 1,000 800 600 400 200 - 1970 1973 1976 1979 1982 1985 1988 1991 1994 1997 2000 2003 2006 2009 2012 2015 pasture price capitalized pasture value USDA/NASS + 10 year t-note
US and OK Land Values 4,500 4,000 3,500 3,000 $/acre 2,500 2,000 1,500 1,000 500 0 US Pasture Land Value OK Pasture Land Value US Cropland Value OK Non-irrig Cropland Value USDA-NASS
Oklahoma Farmland Values 1,800 1,600 1,400 1,200 $/acre 1,000 800 600 400 200 - Pasture Non-irrigated cropland USDA/NASS
Percent Change in Farmland Values 35% 30% 25% Percent change 20% 15% 10% 5% 0% -5% Pasture Non-irrigated cropland USDA/NASS
Oklahoma Land Values 2500 2000 1500 $/acre 1000 500 0 1998 2000 2002 2004 2006 2008 2010 2012 2014 Pasture OSU Pasture NASS Cropland OSU Cropland NASS
Crop Land Cash Rent, 2015 ($ per acre) 208 69 33 181 146 158 134 126 59.5 118 82.5 250 206 67 150 197 68.5 228 40 97.5 74.5 65.5 57.5 148 132 329 88.5 101 33.5 215 106 44 93 60.5 116 110 N/A 39 25 to 50 90.5 110 51 to 100 101 to 150 >151 USDA/NASS data
Oklahoma Non-Irrigated Cropland Cash Rents and Land Prices 1,800 35 1,600 30 1,400 Cash Rent ($/ac) Land Value ($/ac) 25 1,200 20 1,000 800 15 600 10 400 5 200 0 0 1970 1973 1976 1979 1982 1985 1988 1991 1994 1997 2000 2003 2006 2009 2012 2015 Land Value Cash Rent USDA/NASS
Average Pastureland Rent, 2015 ($ per acre) 5.80 18 15 28 12 27 34 5 50 27 28.50 35 5 5 21 34 20 14 27 27 20 12 18 3 23 28 19 N/A 7.50 0 to 5 17 13 5 to 14 15 to 24 25 to 50 USDA/NASS data
Oklahoma Pasture Cash Rents and Land Prices 1,600 14 1,400 12 Land Value ($/ac) Cash Rent ($/ac) 1,200 10 1,000 8 800 6 600 4 400 2 200 0 0 1970 1973 1976 1979 1982 1985 1988 1991 1994 1997 2000 2003 2006 2009 2012 2015 Year Land Value Cash Rent USDA/NASS
US and OK Cropland and Pasture Rent to Value Ratios 6 5 Rent to Value 4 3 2 1 0 US Cropland Rent to Value OK Non-Irrig Cropland Rent to Value US Pasture Rent to Value OK Pasture Rent to Value USDA/NASS
Recommend
More recommend