
SLIDE 1
92
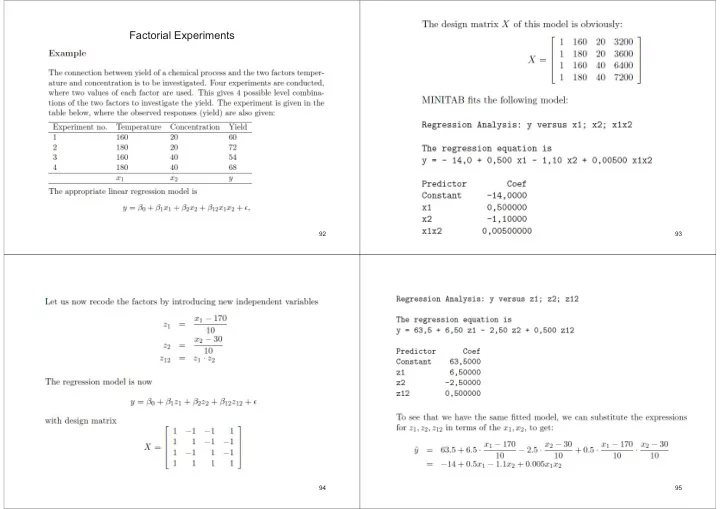
Factorial Experiments
93 94 95
Factorial Experiments 92 93 94 95 96 97 Back to two-factor - - PowerPoint PPT Presentation
Factorial Experiments 92 93 94 95 96 97 Back to two-factor experiment 98 99 Interaction effects DOE terminology main effects: 100 101 Three factors z1 z2 z3 z12 z13 z23 z123 102 103 Two-factor
92
93 94 95
96 97 98 99
100
101
102 103
z1 z2 z3 z12 z13 z23 z123
104
105
106
107
108 109
110
111
Full Factorial Design Factors: 4 Base Design: 4; 16 Runs: 16 Replicates: 1 Blocks: 1 Center pts (total): 0 All terms are free from aliasing.
112
Factorial Fit: Y versus A; B; C; D Estimated Effects and Coefficients for Y (coded units) Term Effect Coef Constant 72,250 A -8,000 -4,000 B 24,000 12,000 C -2,250 -1,125 D -5,500 -2,750 A*B 1,000 0,500 A*C 0,750 0,375 A*D -0,000 -0,000 B*C -1,250 -0,625 B*D 4,500 2,250 C*D -0,250 -0,125 A*B*C -0,750 -0,375 A*B*D 0,500 0,250 A*C*D -0,250 -0,125 B*C*D -0,750 -0,375 A*B*C*D -0,250 -0,125 S = *
113
Analysis of Variance for Y (coded units) Source DF Seq SS Adj SS Adj MS F P Main Effects 4 2701,25 2701,25 675,313 * * 2-Way Interactions 6 93,75 93,75 15,625 * * 3-Way Interactions 4 5,75 5,75 1,438 * * 4-Way Interactions 1 0,25 0,25 0,250 * * Residual Error 0 * * * Total 15 2801,00
114
Effect Percent 25 20 15 10 5
99 95 90 80 70 60 50 40 30 20 10 5 1
Factor D Name A A B B C C D
Effect Type Not Significant Significant BD D B A
Normal Probability Plot of the Effects
(response is Y, Alpha = ,05) Lenth's PSE = 1,125
115 Term Effect
AD CD ACD ABCD ABD AC ABC BCD AB BC C BD D A B
25 20 15 10 5 2,89
Factor D Name A A B B C C D
Pareto Chart of the Effects
(response is Y, Alpha = ,05) Lenth's PSE = 1,125
116
Mean of Y
1
84 78 72 66 60 1
1
84 78 72 66 60 1
A B C D
Main Effects Plot (data means) for Y
117
A 1
1
1
80 70 60 B 80 70 60 C 80 70 60 D
A
1 B
1 C
1
Interaction Plot (data means) for Y
118
119 Factorial Fit: Y versus A; B; C Estimated Effects and Coefficients for Y (coded units) Term Effect Coef SE Coef T P Constant 64,250 0,7071 90,86 0,000 A 23,000 11,500 0,7071 16,26 0,000 B -5,000 -2,500 0,7071 -3,54 0,008 C 1,500 0,750 0,7071 1,06 0,320 A*B 1,500 0,750 0,7071 1,06 0,320 A*C 10,000 5,000 0,7071 7,07 0,000 B*C 0,000 0,000 0,7071 0,00 1,000 A*B*C 0,500 0,250 0,7071 0,35 0,733 S = 2,82843 R-Sq = 97,63% R-Sq(adj) = 95,55% Analysis of Variance for Y (coded units) Source DF Seq SS Adj SS Adj MS F P Main Effects 3 2225,00 2225,00 741,667 92,71 0,000 2-Way Interactions 3 409,00 409,00 136,333 17,04 0,001 3-Way Interactions 1 1,00 1,00 1,000 0,13 0,733 Residual Error 8 64,00 64,00 8,000 Pure Error 8 64,00 64,00 8,000 Total 15 2699,00
120 Term Standardized Effect BC ABC C AB B AC A 18 16 14 12 10 8 6 4 2 2,31
Factor Name A A B B C C
Pareto Chart of the Standardized Effects
(response is Y, Alpha = ,05) 121 Standardized Effect Percent 15 10 5
99 95 90 80 70 60 50 40 30 20 10 5 1
Factor Name A A B B C C
Effect Type Not Significant Significant AC B A
Normal Probability Plot of the Standardized Effects
(response is Y, Alpha = ,05) 122
Blocking in 2^k experiments
Full experiment:
Two blocks:
Use column ABC as generator, i.e. Block 1 consists of experiments with ABC = -1 Block 2 consists of experiments with ABC = 1
123
The interaction ABC is confounded (”mixed”) with the block effect. This means that the value of the estimated coefficient of ABC can be due to both interaction effect and block-effect. Suppose all Y in block 2 are increased by a value h. Then the estimated effect of ABC will increase by h. But one cannot know from observations whether this is due to the interaction ABC or the block effect. On the other hand, the estimated main effects A,B,C and the two-factor interactions AB,AC,BC are not changed by the h. These are of most importance to estimate, so the choice of blocking seems reasonable.
124
Four blocks in 2^3 experiment
Need two columns of +/- to define 4 blocks. Turns out that the best
is default in MINITAB Block 1: Experiments where AB = AC = -1 Block 2: Experiments where AB = -1, AC = 1 Block 3: Experiments where AB = 1, AC = -1 Block 4: Experiments where AB = AC = 1
125
Block structure is as follows:
Interaction effects AB and AC are confounded with the block effect, since they are generators for the blocks. In addition, their product AB*AC = AABC = BC is confounded with the block effect (Note: the BC column is constant within each block. Adding h2 to block 2, h3 to block 3, h4 to block 4 does not change estimated effects of A,B,C, and also does not change the third order interaction ABC. However, e.g. AB will change by 2h3+2h4-2h2 and we do not know whether this is due to an interaction effect or blocking effect: This is CONFOUNDING.
126
How to determine which columns to use for blocking?
Idea: Try to leave estimates for main effects and low order interactions unchanged by blocking. Note: I = AA = BB = CC where I is a column of 1’s Find the blocks for a 2^3 experiment using columns ABC and AC. The interaction between ABC and AC is ABC*AC = AA*B*CC = B which is a main effect, which hence is confounded with the block effect (in addition to ABC and AC)
127
128
129 130 131
132
133
134
135
136 137 138 139
140
From Exam in TMA4260 Industrial Statistics, december 2003, Exercise 2 A company decides to investigate the hardening process of a ballbearing production. The following four factors are chosen: A: content of added carbon B: Hardening temperature C: Hardening time D: Cooling temperature. Design and results are given below: a) What is the generator and the defining relation of the design, and what is the design’s resolution? Write down the alias structure. Find the estimates of the main effect of A and the interaction effect AC.
141
b) What is the variance of the main effect A and the interaction AC? Assume that the st deviation sigma has been estimated from other experiments, by s = 0.312 with 9 degrees of freedom (in the exam, this had been done in Ex 1.) Use this estimate to find out whether the interaction AC is significantly different from 0 (i.e. ”active”) Use 5% significance level. What is the conclusion of the experiment so far?
142
The company is well satisfied with the results so far and they decide to carry out also the other half fraction. The result of the other half fraction is given below.
143
Use this to find unconfounded estimates for the main effects and the two-factor interactions. Assume that one would like to estimate the variance of the effects from the higher order interactions. Explain how this can be done, and find the estimate. Is it wise to include the four-factor interaction in this calculation? Why (not)? Later, one of the operators that participated in the experiments asked whether
he said, have simplified considerably the performance of the experiments. What answer would you give to the operator?
144
From Exam in SIF 5066 Experimental design and…, May 2003, Exercise 1 A company making ballbearings experienced problems with the lifetimes of the
A: type of ball – standard (-) or modified (+) B: type of cage - standard (-) or modified (+) C: type of lubricate - standard (-) or modified (+) D: quantity of lubricate – normal (-) or large (+) The repsonse was the lifetime of the ballbearing in an accelerated life testing
145
A: type of ball B: type of cage C: type of lubricate D: quantity of lubricate a) What type of experiment is this? What is the defining relation? What is the resolution? Calculate estimates of the main effect of A and the two-factor interaction AB. b) Estimated contrasts for B,C,D,AC,AD are, respectively, 0.60, 0.31, 0.22, -0.11,
ABD,ABC? Assume that factors C and D do not influence the response. Explain why this is then a 2^2 experiment with replicate. Calculate an estimate for the variance of the effects, and find out whether A, B and AB are now significant. c) Give an interpretation of the results. The experiment was in fact carried out in two blocks, where experiments 1-4 was one block and 5-8 the other. How is this blocking constructed? How will we need to modify the analysis of significance in (b)? (Assume again that C,D do not influence the response)