
Martin Theus Department of Computational Statistics and Data Analysis, Augsburg University, Germany Interactive Graphics for Statistics: Principles and Examples Augsburg, May 31., 2006
Extensible Interactive Graphics
Simon Urbanek Martin Theus
Martin Theus RoSuDa, Augsburg University, Germany Simon Urbanek AT&T Labs, Florham Park, NJ Extensible Interactive Graphics
iPlots: Motivation
- R is good at managing
– data – models – (static) graphics
but is less strong in exploratory data analysis
- Interactive Statistical Graphics (ISG) is good at
– supporting exploratory analyses – checking data quality – revealing structure in data
but can not be automated or scripted
- Solution: Bring both tools/paradigms together
2
Martin Theus RoSuDa, Augsburg University, Germany Simon Urbanek AT&T Labs, Florham Park, NJ Extensible Interactive Graphics
Bringing Interactive Graphics and R together
- Different ways of bringing ISG and R together
- 1. Run two applications in parallel
pros: full feature-set of both applications available cons: two different user interfaces, coupling relatively loose example: ggobi
- 2. Use R as stat-computing engine
pros: no need to learn R, only one interface cons: only packaged functionality, no extensibility example: KLIMT, Mondrian (all via Rserve)
- 3. Add interactive plots within R
pros: one interface, still “just” R, flat learning curve cons: can not be implemented using R graphics example: iPlots
3
Martin Theus RoSuDa, Augsburg University, Germany Simon Urbanek AT&T Labs, Florham Park, NJ Extensible Interactive Graphics
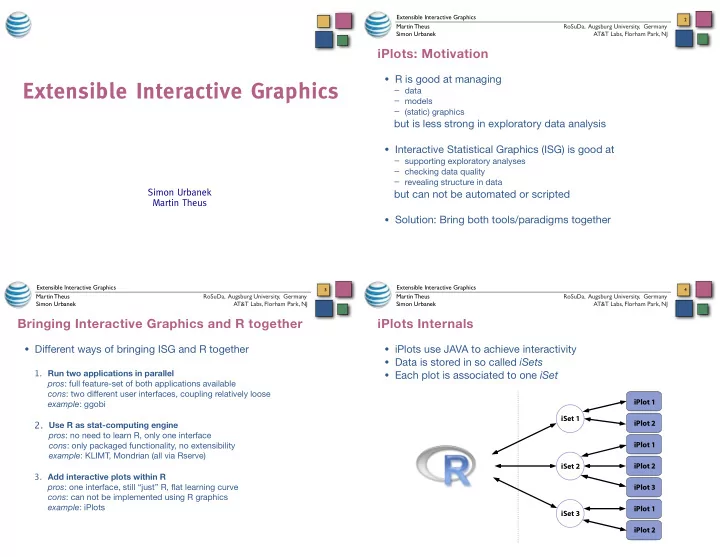
iPlots Internals
- iPlots use JAVA to achieve interactivity
- Data is stored in so called iSets
- Each plot is associated to one iSet
4