
SLIDE 1
Estimating Income Effects
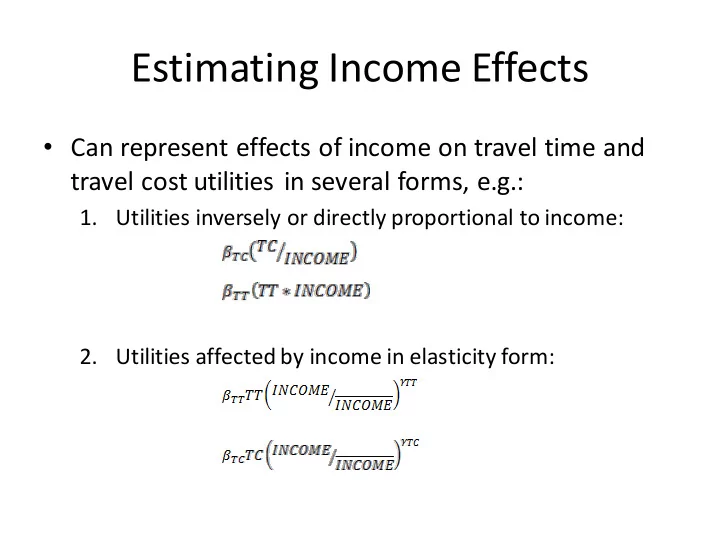
- Can represent effects of income on travel time and
travel cost utilities in several forms, e.g.:
- 1. Utilities inversely or directly proportional to income:
- 2. Utilities affected by income in elasticity form: