EPCOR Utilities Inc. CIBC Calgary Fixed Income Conference April - - PowerPoint PPT Presentation

epcor utilities inc
SMART_READER_LITE
LIVE PREVIEW

EPCOR Utilities Inc. CIBC Calgary Fixed Income Conference April - - PowerPoint PPT Presentation

EPCOR Utilities Inc. CIBC Calgary Fixed Income Conference April 2016 Guy Bridgeman Guy Bridgeman Senior Vice President & Chief Financial Officer Bryan Kornfeld Senior Vice President & Chief Financial Officer Senior Manager, Corporate


slide-1
SLIDE 1

1

EPCOR Utilities Inc.

CIBC Calgary Fixed Income Conference

April 2016

Guy Bridgeman Senior Vice President & Chief Financial Officer Bryan Kornfeld Senior Manager, Corporate Finance

Guy Bridgeman Senior Vice President & Chief Financial Officer Bryan Kornfeld Senior Manager, Corporate Finance

slide-2
SLIDE 2

2

Forward-Looking Information

Certain information in this presentation and in oral answers to questions may contain forward-looking information statements or forward-looking information together, “forward-looking information together”. Forward-looking information is based on current expectations, estimates and projections that involve a number of risks which could cause actual results to vary and in some instances to differ materially from those anticipated by EPCOR. Forward-looking information is based on the estimates and opinions of management at the time the information is presented. Actual results could differ materially from conclusions, forecasts or projections in the forward-looking information, and certain material factors or assumptions were applied in drawing conclusions or making forecasts or projections as reflected in the forward-looking

  • information. Additional information about the material factors and risks that could cause actual results to

differ materially from the conclusions, forecasts or projections in the forward-looking information and the material factors or assumptions that were applied in drawing a conclusion or making a forecast or projection as reflected in the forward-looking information is contained in the most recent interim and annual Management Discussion and Analysis filed on SEDAR (www.sedar.com) and EPCOR’s website (www.epcor.com). Readers are cautioned not to place undue reliance on forward-looking statements as actual results could differ materially from the plans, expectations, estimates or intentions expressed in the forward-looking

  • statements. Except as required by law, EPCOR assumes no obligation to update any forward-looking

information, should circumstances or management’s estimates or opinions change, or any other reason.

slide-3
SLIDE 3

3

EPCOR Overview

slide-4
SLIDE 4

4

EPCOR – Corporate Snapshot

  • Stand-alone corporation, owned solely

by City of Edmonton – no reliance on shareholder to fund investments.

  • Governed by independent Board of

Directors.

  • Long-life, high quality, infrastructure

asset in North America.

  • Predominantly rate regulated business

with limited commercial exposure, carried under long term contract with investment grade counterparties.

  • Regulatory and geographic diversity.
  • Strong, stand-alone investment grade

credit ratings.

  • Issuer of public and private debt.
slide-5
SLIDE 5

5

EPCOR Operations

  • Builder, owner, operator of electrical transmission and distribution networks, water

and wastewater treatment facilities and infrastructure and provider of retail energy products.

slide-6
SLIDE 6

6

  • Excellent risk profile
  • exposure to power generation significantly reduced since spin-off in 2009.
  • Mostly rate regulated.
  • Good sector and geographic diversity.
  • Excellent credit profile
  • Strong balance sheet.
  • Strong operating cash flow and related solvency metrics.
  • Cash from operations is sufficient to fund organic growth and dividend.
  • Excellent growth profile
  • 2/3 of capital investment is in regulated businesses – funded from
  • perations.
  • 1/3 related to business development – funded by debt issuance.
  • Focus on development projects (P3, selenium, greenfield natural gas).
  • Disciplined development process within Risk Appetite Framework.

EPCOR Financial Profile

slide-7
SLIDE 7

7

Financial Overview

slide-8
SLIDE 8

8

  • Sold majority of the power generation business, re-investing in lower risk

wires and water utility infrastructure.

Risk Re-Orientation

Pre-split Level

$ Million

$330 $203 $188 $251 $290 $365

Operating Income

$285

slide-9
SLIDE 9

9

Overview of Full Year 2015 Results

($ millions) 2015 2014 Revenue $2,108 $1,927 Net Income from Core Operations 245 168 Funds From Operations 433 337 Investment in Capital Power 167 393 Total Debt 2,117 2,080 Gross Assets 6,088 5,738

slide-10
SLIDE 10

10

1 All amounts in millions of CDN dollars, as of December 31, 2015

2015 – Financial Overview

slide-11
SLIDE 11

11

Strong Business Risk Profile

  • Concentration in rate-regulated businesses.
  • Multiple business lines, with regulatory and

geographic diversification.

  • Prudent exposure to contracted business.

Strong Financial Risk Profile

  • Strong and growing cash flow.
  • Strong balance sheet.
  • Solid credit metrics.
  • Excellent debt maturity profile.
  • Prudent pacing of capital expenditure program.

Credit Ratings

  • S&P: A-; stable outlook.
  • DBRS: A (low); stable outlook.

Credit Profile

Note: Excludes interest income from Capital Power on back- to-back long-term receivable.

slide-12
SLIDE 12

12

Cash Flow and Leverage

  • FFO compound average annual

rate of 23% since 2010.

  • FFO largely funding sustainable

CAPEX and Dividends.

  • Prudent leverage provides

capacity to add debt.

slide-13
SLIDE 13

13

Improving Solvency

Interest Coverage net of impacts from

Capital Power

  • Financial capacity and

flexibility evident with improving coverage ratios.

  • Strengthening cash flow and

earnings, driven by BU performance.

  • Reinvestment of Capital

Power divestiture into core businesses.

  • Diminishing impact from

Back-to-Back debt with Capital Power; end in sight.

slide-14
SLIDE 14

14

Debt Maturities

  • Debt maturities are well spaced without any notable pressure points.
  • 2016 maturity was paid March 22, 2016.
  • 2018 debt maturity is $236 million, not inclusive of Capital Power’s

backing obligation.

slide-15
SLIDE 15

15

  • Good access to capital and short-term liquidity
  • Committed credit facilities of $550 million – supporting $350 million CP

Program.

  • Unutilized $1 billion Short Term Base Shelf.
  • Dividend obligation of $141 million until a change is recommended by

the Board and approved by the Shareholder.

  • Debt maturities generally align with asset lives financed with debt profile

laddered appropriately.

  • Debt is denominated in currency to match cash flow and sourced at

lowest economic cost.

  • Expecting to issue debt to fund development growth.
  • As circumstances dictate, preferred shares/hybrid financing will be

considered as well as further sell down of Capital Power equity stake.

Financing Summary

slide-16
SLIDE 16

16

Regulatory Update

slide-17
SLIDE 17

17

Water

Water Canada – Regulatory Update

  • Approved ROE for Edmonton Water and Wastewater remains at 10.875%.
  • Approved capital structure remains 60% debt to 40% equity.
  • Submitting 2017-2021 PBR application in the second quarter of 2016.

Water USA – Regulatory Update

  • Regulatory tone remains positive.
  • Improved regulatory mechanism brings assets into rate base with minimal lag.
slide-18
SLIDE 18

18

Regulatory Update

  • Utility Asset Disposition ruling upheld original decision regarding stranded

assets – no rating downgrades occurred because of it or are expected.

  • Distribution received very favorable decision on its 2016-2017 capital tracker

application, including Advanced Meter Infrastructure.

  • Distribution filed its second generation PBR proposal on March 23, 2016.
  • Generic Cost of Capital proceedings will conclude this year, deciding the 2016

and 2017 return on equity rates. The rates for 2013, 2014 and 2015 were:

Distribution & Transmission

Entity Equity Capital ROE Rate Transmission 36% 8.3% Distribution 40% 8.3%

slide-19
SLIDE 19

19

Energy Services

Regulatory Update - Energy Price Setting Plan Amendment

  • February 2014 - AUC approved the corporate reorganization resulting in

significant cash tax savings through utilization of tax loss carry forwards.

  • 2014 – 2018 Energy Price Setting Plan (EPSP) Compliance filing approved

by the regulator with implementation August 2016.

  • Approval provides reduced exposure to energy risk and compensation for

commodity losses.

  • Next EPSP Application anticipated in Q3 of 2016 – covering period after

April 30, 2018.

slide-20
SLIDE 20

20

Strategy & Growth

slide-21
SLIDE 21

21

Strategic Direction

  • Balanced growth profile
  • Investments weighted toward regulated and contracted utility

infrastructure.

  • Scale of commercial and industrial investment appropriate to

maintain current credit ratings.

  • Development
  • 2/3 of capital development in organic growth.
  • Develop a new operating hub - greenfield natural gas in

Ontario.

  • Partner with municipalities for new water / wastewater needs.
  • P3 / concession projects.
  • Market reputation
  • Continue to build reputation as a trusted developer and
  • perator of utility assets.
  • Zero injury culture.
  • Service reliability.
  • Environmental responsibility.
slide-22
SLIDE 22

22

P3 Development

  • Continue to build on success in P3 space.
  • Regina Wastewater Treatment Plant expansion upgrade costing $158 million

with EPCOR providing long-term financing of $79 million at completion in 2016.

  • Evan-Thomas Water and Wastewater Facility contract with Alberta Infrastructure
  • n $37.6 million expansion and upgrade completed in 2014.

Water – Municipal

Water and Wastewater – Municipal

  • Significant opportunity to invest in

municipal infrastructure which the federal government has identified as a top priority – i.e. Lloydminster.

slide-23
SLIDE 23

23

Water – Commercial

Water treatment opportunity in mining sector

  • Mining is a battered industry; low point in

commodity cycle.

  • Environmental pressure to manage the release of

Selenium caused by mining into waterways is another heavy burden.

  • Selenium is a harmful element to fish.
  • The US EPA is expressing urgency.
  • EPCOR succeeded in removal of heavy

metals from the Britannia mine site.

  • Possibilities exist for EPCOR to place capital in

water treatment facilities focused on selenium removal.

slide-24
SLIDE 24

24

New Hub – Ontario Natural Gas

  • Expansion into natural gas distribution
  • EPCOR successful in bid for rights to develop and operate a rate

regulated natural gas distribution utility.

  • Initially to three municipalities in the South Bruce region of Ontario.
  • Kincardine
  • Arran-Elderslie
  • Huron Kinloss
  • Franchise agreements

in place with all three municipalities.

  • Rate regulated by

Ontario Energy Board (OEB).

  • Subject to OEB

approval.

slide-25
SLIDE 25

25

Thank you for your time

slide-26
SLIDE 26

26

Appendix

slide-27
SLIDE 27

27

  • Sale of Capital Power LP units in 2010, 2011,

2012, 2013 and 2015.

  • Approximately $1.1 billion in total gross

proceeds.

  • Dilution in 2011 and 2014 by Capital Power.
  • Back-to-back debt owed to EPCOR by Capital

Power relates to generation assets transferred to Capital Power LP in 2009.

  • Remainder to be repaid in full by June 2018.
  • Significant repayment: 2018 - $184 million.

EPCOR plans to divest all or a significant portion of its interest in Capital Power over time according to capital requirements and as market conditions permit.

Interest in Capital Power

slide-28
SLIDE 28

28

Water Services Operations

Municipal Water and Wastewater City of Edmonton Municipal Water and Wastewater Alberta/British Columbia/Saskatchewan/USA

Water Treatment & Distribution

  • Two large water treatment plants on the North Saskatchewan river –

capacity of 680 million liters/day.

  • Rates regulated by City of Edmonton under a PBR covering 2012-

2017.

  • Serves population over 800,000 plus bulk water sales to over 65

Alberta capital region communities and counties.

Wastewater Treatment

  • Enhanced primary treatment – 1,200 million liters/day.
  • Rates regulated by City of Edmonton under PBR covering 2012-2017.

Alberta

  • Operating contracts in Canmore, Chestermere, Okotoks, Red Deer

County, Strathmore, Taber.

British Columbia Utility

  • Regulated water in French Creek.
  • Operating contract in Sooke.

Saskatchewan

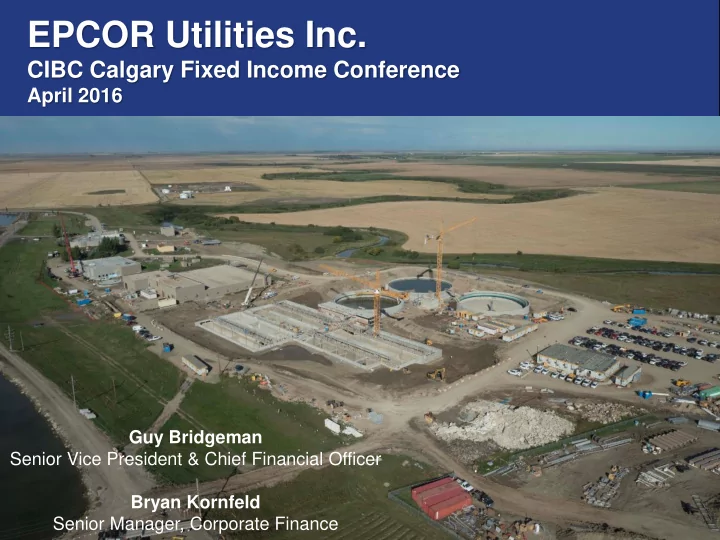
  • Wastewater facility expansion and operating contract in Regina -

assumed operations and commenced construction in 2015.

Arizona and New Mexico

  • Regulated water utility – Chaparral City Water Company, EPCOR

Water Arizona, EPCOR Water New Mexico.

  • Provide water and wastewater services to approximately 305,000

customer through more than 203,000 service connections across 22 communities and seven counties.

Industrial Water and Wastewater

Alberta

  • Own three water treatment and three wastewater treatment facilities at Suncor’s Fort McMurray Oil Sands operations under long-term contracts.
  • Operate three water treatment and four wastewater treatment facilities at Suncor and Shell Albian Sands oil sands operations in Fort McMurray.

British Columbia

  • Operate the Britannia Mine wastewater treatment facility, and the Sparwood facility at the Teck Resources (Teck) site.
slide-29
SLIDE 29

29

Business / Operational Efficiency

Water Canada

  • Operating income has been trending

upwards due to a favorable regulatory environment, increased customer base, higher approved customer rates and favorable weather conditions. Water USA

  • Rate increases, increased sales in

higher rate blocks and improved

  • perational efficiency has contributed

to strong financial performance.

slide-30
SLIDE 30

30

Electricity Operations

Electricity Distribution and Transmission Technologies

  • Distribute to approximately 370,000 sites within Edmonton with

high reliability.

  • Approximately 5,500 km of distribution and 260 km of transmission

lines, both aerial and underground.

  • 51,000 poles with 11,500 aerial transformers and more than

19,400 underground transformer.

  • Own and operate 35 transmission and five distribution substations.
  • Regulated by the Alberta Utilities Commission (AUC) – Distribution

(PBR) /Transmission (cost of service).

  • Provide design, construction and maintenance services for street

lighting, traffic signals and Light Rail Transit systems in Edmonton, Calgary and other municipalities.

slide-31
SLIDE 31

31

Business / Operational Efficiency

  • Operating income increased compared with 2014 primarily due to higher provincial

system access fee revenue collections, higher distribution access rates and lower

  • perating costs.
  • 99.9% reliability rating in 2015.

Distribution & Transmission

$ Million

slide-32
SLIDE 32

32

Energy Services

Regulated Operations Encor by EPCOR

  • Provide RRO (procurement, billing and customer care) for

approximately 600,000 Edmonton and Fortis Alberta energy customers.

  • Regulated by AUC on a cost-of-service based framework.
  • Provide billing and customer care for approximately 265,000

EPCOR water customers in Edmonton and City of Edmonton drainage and waste collection services.

  • Owing to market conditions and low RRO rates, EPCOR has

returned to net site growth not experienced since the 2009-2011 period, and gained 7,500 RRO customers in 2015.

  • Competitive Retail energy provider under Encor by EPCOR.

Provide procurement, billing and customer care services to Alberta retail electricity and gas customers under competitive contract.

  • Currently offers fixed and floating electricity and gas contracts with

all commodity risk transferred to the third party.

  • Introduced new green competitive product offerings for gas and

electricity contracts. Encor green energy is sourced from 100% Canadian renewable energy projects.

slide-33
SLIDE 33

33

Energy Services

Business / Operational Efficiency

  • Operating income increased significantly due to higher billing charge rates, higher

favorable fair value adjustments related to financial electricity purchase contracts, and higher EPSP margins.

$ Million