Engineering Economics 4-1 Cash Flow Cash flow is the sum of money - - PowerPoint PPT Presentation

engineering economics 4 1
SMART_READER_LITE
LIVE PREVIEW

Engineering Economics 4-1 Cash Flow Cash flow is the sum of money - - PowerPoint PPT Presentation

Engineering Economics 4-1 Cash Flow Cash flow is the sum of money recorded as receipts or disbursements in a projects financial records. A cash flow diagram presents the flow of cash as arrows on a time line scaled to the magnitude of the


slide-1
SLIDE 1

Professional Publications, Inc.

FERC

4-1 Engineering Economics

Cash Flow

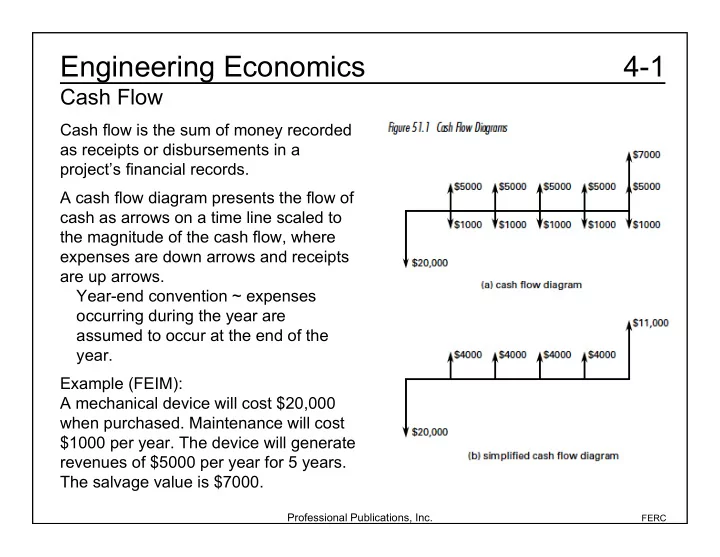
Cash flow is the sum of money recorded as receipts or disbursements in a project’s financial records. A cash flow diagram presents the flow of cash as arrows on a time line scaled to the magnitude of the cash flow, where expenses are down arrows and receipts are up arrows. Year-end convention ~ expenses

  • ccurring during the year are

assumed to occur at the end of the year. Example (FEIM): A mechanical device will cost $20,000 when purchased. Maintenance will cost $1000 per year. The device will generate revenues of $5000 per year for 5 years. The salvage value is $7000.

slide-2
SLIDE 2

Professional Publications, Inc.

FERC

4-2a1 Engineering Economics

Discount Factors and Equivalence

Present Worth (P): present amount at t = 0 Future Worth (F): equivalent future amount at t = n of any present amount at t = 0 Annual Amount (A): uniform amount that repeats at the end of each year for n years Uniform Gradient Amount (G): uniform gradient amount that repeats at the end of each year, starting at the end of the second year and stopping at the end of year n.

slide-3
SLIDE 3

Professional Publications, Inc.

FERC

4-2a2 Engineering Economics

Discount Factors and Equivalence

NOTE: To save time, use the calculated factor table provided in the NCEES FE Handbook.

slide-4
SLIDE 4

Professional Publications, Inc.

FERC

4-2b Engineering Economics

Discount Factors and Equivalence

Example (FEIM): How much should be put in an investment with a 10% effective annual rate today to have $10,000 in five years? Using the formula in the factor conversion table, P = F(1 + i) –n = ($10,000)(1 + 0.1) –5 = $6209 Or using the factor table for 10%, P = F(P/F, i%, n) = ($10,000)(0.6209) = $6209

slide-5
SLIDE 5

Professional Publications, Inc.

FERC

4-2c Engineering Economics

Discount Factors and Equivalence

Example (FEIM): What factor will convert a gradient cash flow ending at t = 8 to a future value? The effective interest rate is 10%. The F/G conversion is not given in the factor table. However, there are different ways to get the factor using the factors that are in the table. For example, NOTE: The answers arrived at using the formula versus the factor table turn out to be slightly different. On economics problems, one should not worry about getting the exact answer. = (11.4359)(3.0045) = 34.3592 (F/G,i%,8) = (F/A,10%,8)(A/G,10%,8) (F/G,i%,8) = (P/G,10%,8)(F/P,10%,8) = (16.0287)(2.1436) = 34.3591

  • r
slide-6
SLIDE 6

Professional Publications, Inc.

FERC

4-3 Engineering Economics

Nonannual Compounding

Effective Annual Interest Rate An interest rate that is compounded more than once in a year is converted from a compound nominal rate to an annual effective rate. Effective Interest Rate Per Period Effective Annual Interest Rate Example (FEIM): A savings and loan offers a 5.25% rate per annum compound daily over 365 days per year. What is the effective annual rate? ie = 1+ r m

  • m

1= 1+ 0.0525 365

  • 365

1= 0.0539

slide-7
SLIDE 7

Professional Publications, Inc.

FERC

4-4 Engineering Economics

Discount Factors for Continuous Compounding

The formulas for continuous compounding are the same formulas in the factor conversion table with the limit taken as the number of periods, n, goes to infinity.

slide-8
SLIDE 8

Professional Publications, Inc.

FERC

4-5a Engineering Economics

Comparison of Alternatives

Present Worth When alternatives do the same job and have the same lifetimes, compare them by converting each to its cash value today. The superior alternative will have the highest present worth. Example (EIT8):

slide-9
SLIDE 9

Professional Publications, Inc.

FERC

4-5b1 Engineering Economics

Comparison of Alternatives

Capitalized Costs Used for a project with infinite life that has repeating expenses every year. Compare alternatives by calculating the capitalized costs (i.e., the amount of money needed to pay the start-up cost and to yield enough interest to pay the annual cost without touching the principal). NOTE: The factor conversion for a project with no end is the limit of the P/A factor as the number of periods, n, goes to infinity.

slide-10
SLIDE 10

Professional Publications, Inc.

FERC

4-5b2 Engineering Economics

Comparison of Alternatives

Example (EIT8):

slide-11
SLIDE 11

Professional Publications, Inc.

FERC

4-5c Engineering Economics

Comparison of Alternatives

Annual Cost When alternatives do the same job but have different lives, compare the cost per year of each alternative. The alternatives are assumed to be replaced at the end of their lives by identical alternatives. The initial costs are assumed to be borrowed at the start and repaid evenly during the life of the alternative. Example (EIT8):

slide-12
SLIDE 12

Professional Publications, Inc.

FERC

4-5d Engineering Economics

Comparison of Alternatives

Cost-Benefit Analysis Project is considered acceptable if B – C ≥ 0 or B/C ≥ 1. Example (FEIM): The initial cost of a proposed project is $40M, the capitalized perpetual annual cost is $12M, the capitalized benefit is $49M, and the residual value is $0. Should the project be undertaken? B = $49M, C = $40M + $12M + $0 B – C = $49M – $52M = –$3M < 0 The project should not be undertaken.

slide-13
SLIDE 13

Professional Publications, Inc.

FERC

4-5e Engineering Economics

Comparison of Alternatives

Rate of Return on an Investment (ROI) The ROI must exceed the minimum attractive rate of return (MARR). The rate of return is calculated by finding an interest rate that makes the present worth zero. Often this must be done by trial and error.

slide-14
SLIDE 14

Professional Publications, Inc.

FERC

4-6a Engineering Economics

Depreciation

Straight Line Depreciation The depreciation per year is the cost minus the salvage value divided by the years of life.

slide-15
SLIDE 15

Professional Publications, Inc.

FERC

4-6b Engineering Economics

Depreciation

Accelerated Cost Recovery System (ACRS) The depreciation per year is the cost times the ACRS factor (see the table in the NCEES Handbook). Salvage value is not considered.

slide-16
SLIDE 16

Professional Publications, Inc.

FERC

4-6c Engineering Economics

Depreciation

Example (FEIM): An asset is purchased that costs $9000. It has a 10-year life and a salvage value of $200. Find the straight-line depreciation and ACRS depreciation for 3 years. Straight-line depreciation/year ACRS depreciation First year ($9000)(0.1) = $ 900 Second year ($9000)(0.18) = $1620 Third year ($9000)(0.144) = $1296 = $9000 $200 10 = $880/ yr

slide-17
SLIDE 17

Professional Publications, Inc.

FERC

4-6d Engineering Economics

Depreciation

Book Value The assumed value of the asset after j years. The book value (BVj) is the initial cost minus the sum of the depreciations out to the j th year. Example (FEIM): What is the book value of the asset in the previous example after 3 years using straight-line depreciation? Using ACRS depreciation? Straight-line depreciation $9000 – (3)($800) = $6360 ACRS depreciation $9000 – $900 – $1620 – $1296 = $5184

slide-18
SLIDE 18

Professional Publications, Inc.

FERC

4-7a Engineering Economics

Tax Considerations

Expenses and depreciation are deductible, revenues are taxed. Example (EIT8):

slide-19
SLIDE 19

Professional Publications, Inc.

FERC

4-7b Engineering Economics

Tax Considerations

Tax Credit A one-time benefit from a purchase that is subtracted from income taxes. Example (EIT8):

slide-20
SLIDE 20

Professional Publications, Inc.

FERC

4-7c Engineering Economics

Tax Considerations

Gain or loss on the sale of an asset: If an asset has been depreciated and then is sold for more than the book value, the difference is taxed.

slide-21
SLIDE 21

Professional Publications, Inc.

FERC

4-8 Engineering Economics

Bonds

Bond value is the present worth of payments over the life of the bond. Bond yield is the equivalent interest rate of the bond compared to the bond cost. Example (EIT8):

slide-22
SLIDE 22

Professional Publications, Inc.

FERC

4-9 Engineering Economics

Break-Even Analysis

Calculating when revenue is equal to cost, or when one alternative is equal to another if both depend on some variable. Example (FEIM): How many kilometers must a car be driven per year for leasing and buying to cost the same? Use 10% interest and year-end cost. Leasing: $0.15 per kilometer Buying: $5000 purchase cost, 3-year life, salvage $1200, $0.04 per kilometer for gas and oil, $500 per year for insurance EUAC (leasing) = $0.15x, where x is kilometers driven EUAC (buying) = $0.04x + $500 + ($5k)(A/P,10%,3) – ($1.2k)(A/F,10%,3) = $0.04x + $500 + ($5k)(0.4021) – ($1.2k)(0.3021) = $0.04x + $2148 Setting EUAC (leasing) = EUAC (buying) and solving for x $0.15x = $0.04x + $2148 x = 19,527 km must be driven to break even

slide-23
SLIDE 23

Professional Publications, Inc.

FERC

4-10 Engineering Economics

Inflation

Inflation-Adjusted Interest Rate

slide-24
SLIDE 24

Professional Publications, Inc.

FERC

4-11a Engineering Economics

Additional Examples

Example 1 (FEIM): What is the uninflated present worth of $2000 in 2 years if the average inflation rate is 6% and i is 10%? d = i + f + if = 0.06 + 0.10 + (0.06)(0.10) = 0.166 P = ($2000)(P/F,16.6%, 2) = ($2000)(1 + d)–n = ($2000)(1 + 0.166)–2 = $1471

slide-25
SLIDE 25

Professional Publications, Inc.

FERC

4-11b Engineering Economics

Additional Examples

Example 2 (FEIM): It costs $75 per year to maintain a cemetery plot. If the interest rate is 6.0%, how much must be set aside to pay for maintenance on each plot without touching the principal? (A) $1150 (B) $1200 (C) $1250 (D) $1300 P = ($75)(P/A,6%,∞) = ($75)(1/0.06) = $1250 Therefore, (C) is correct.

slide-26
SLIDE 26

Professional Publications, Inc.

FERC

4-11c Engineering Economics

Additional Examples

Example 3 (FEIM): It costs $1000 for hand tools and $1.50 labor per unit to manufacture a

  • product. Another alternative is to manufacture the product by an

automated process that costs $15,000, with a $0.50 per-unit cost. With an annual production rate of 5000 units, how long will it take to reach the break-even point? (A) 2.0 yr (B) 2.8 yr (C) 3.6 yr (D) never Cumulative cost (hand tools) = $1000 + $1.50x, where x is the number

  • f units.

Cumulative cost (automated) = $15,000 + $0.50x Set cumulative costs equal and solve for x. $1000 + $1.50x = $15,000 + $0.50x $1x = $14,000

x = 14,000 units

tbreak-even = x/production rate = 14,000/5000 = 2.8 yr Therefore, (B) is correct.

slide-27
SLIDE 27

Professional Publications, Inc.

FERC

4-11d Engineering Economics

Additional Examples

Example 4 (FEIM): A loan of $10,000 is made today at an interest rate of 15%, and the first payment of $3000 is made 4 years later. The amount that is still due on the loan after the first payment is most nearly (A) $7000 (B) $8050 (C) $8500 (D) $14,500 loan due = ($10k)(F/P,15%,4) – $3000 = ($10k)(1 + 0.15)4 – $3000 = ($10k)(1.7490) – $3000 = $14,490 ($14,500) Therefore, (D) is correct.

slide-28
SLIDE 28

Professional Publications, Inc.

FERC

4-11e Engineering Economics

Additional Examples

Example 5 (FEIM): A machine is purchased for $1000 and has a useful life of 12 years. At the end of 12 years, the salvage value is $130. By straight-line depreciation, what is the book value of the machine at the end of 8 years? (A) $290 (B) $330 (C) $420 (D) $580 BV = $1000 – ($1000 – $130)(8/12) = $1000 – $580 = $420 Therefore, (C) is correct.

slide-29
SLIDE 29

Professional Publications, Inc.

FERC

4-11f Engineering Economics

Additional Examples

Example 6 (FEIM): The maintenance cost for an investment is $2000 per year for the first 10 years and $1000 per year thereafter. The investment has infinite life. With a 10% interest rate, the present worth of the annual disbursement is most nearly (A) $10,000 (B) $16,000 (C) $20,000 (D) $24,000 The costs or benefits for a cash flow that repeat should be broken into different benefits and costs that all start or finish at the time of interest. Take the $2000 cost that repeats for 10 years and break it into two $1000 costs to have one $1000 cost that goes on infinitely and one $1000 cost that goes on for 10 years. P = ($1000)(P/A,10%,10) + ($1000)(P/A,10%,∞) = ($1000)(6.1446) + ($1000)(1/0.10) = $6144.6 + $10,000 = $16,144.6 ($16,000) Therefore, (B) is correct.

slide-30
SLIDE 30

Professional Publications, Inc.

FERC

4-11g Engineering Economics

Additional Examples

Example 7 (FEIM): With an interest rate of 8% compounded semiannually, the value of a $1000 investment after 5 years is most nearly (A) $1400 (B) $1470 (C) $1480 (D) $1800 ie = (1 + r/m)m – 1= (1 + 0.08/2)2 – 1 = 0.0816 F = ($1000)(F/P,8.16%,5) = ($1000)(1 + 0.0816)5 = ($1000)(1.480) = $1480 Therefore, (C) is correct.

slide-31
SLIDE 31

Professional Publications, Inc.

FERC

4-11h1 Engineering Economics

Additional Examples

Example 8 (FEIM): The following data applies for example problems 8.1 through 8.3. A company is considering the purchase of either machine A or machine B. machine A machine B initial cost $80,000 $100,000 estimated life 20 years 25 years salvage value $20,000 $25,000

  • ther costs

$18,000 per year $15,000 per year for the first 15 years $20,000 per year for the next 10 years Example 8.1 (FEIM): The interest rate is 10%, and all cash flows may be treated as end-of-year cash

  • flows. Assume that equivalent annual cost is the value of the constant annuity

equal to the total cost of a project. The equivalent annual cost of machine B is most nearly (A) $21,000 (B) $21,500 (C) $23,000 (D) $26,500

slide-32
SLIDE 32

Professional Publications, Inc.

FERC

4-11h2 Engineering Economics

Additional Examples

The $15,000 cost for 15 years and the $20,000 cost for the next 10 years can be broken into a $20,000 cost for the full 25 years and a $5000 benefit that is present for the first 15 years. The present worth of $20k for 25 years is P($20,25) = ($20k)(P/A,10%,25) = ($20k)(9.0770) = $181.54k The present worth of $5k for 15 years is P($5,15) = ($5k)(P/A,10%,15) = ($5k)(7.6061) = 38.03k Pother costs = $181.54 k + $38.03k = $143.51k Aother costs = Pother costs(A/P, 10%, 25) = ($143.51k)(0.1102) = $15,815 EUAC = ($100k)(A/P,10%,25) – ($25k)(A/F,10%,25) + $15,815 = ($100k)(0.1102) – ($25k)(0.0102) + $15,815 = $11,020 – $255 + $15,815 = $26,610 ($26,500) Therefore, (D) is correct.

slide-33
SLIDE 33

Professional Publications, Inc.

FERC

4-11h3 Engineering Economics

Additional Examples

Example 8.2 (FEIM): If funds equal to the present worth of the cost of purchasing and using machine A over 20 years were invested at 10% per annum, the value of the investment at the end of 20 years would be most nearly: (A) $548,000 (B) $676,000 (C) $880,000 (D) $1,550,000 P(A) = $80k + ($20k)(P/F,10%,20) – ($18k)(P/A,10%,20) = $80k + ($20k)(0.1486) – ($18k)(8.5136) = $80k + $2.972k – $153.245k = $230,273 F(A,10%,20) = ($230,273)(F/P,10%,20) = ($230,273)(6.7275) = $1,549,162 ($1,550,000) Therefore, (D) is correct.

slide-34
SLIDE 34

Professional Publications, Inc.

FERC

4-11h4 Engineering Economics

Additional Examples

Example 8.3 (FEIM): How much money would have to be placed in a sinking fund each year to replace machine B at the end of 25 years if the fund yields 10% annual compound interest and if the first cost of the machine is assumed to increase at a 6% annual compound rate? (Assume the salvage value does not change.) (A) $2030 (B) $2510 (C) $2540 (D) $4110 F = P(F/P,6%,25) – salvage value = ($100,000)(4.2919) – $25,000 = $404,190 A = F(A/F,10%,25) = ($404,190)(0.0102) = $4123 ($4110) Therefore, (D) is correct.