
SLIDE 1
1
1
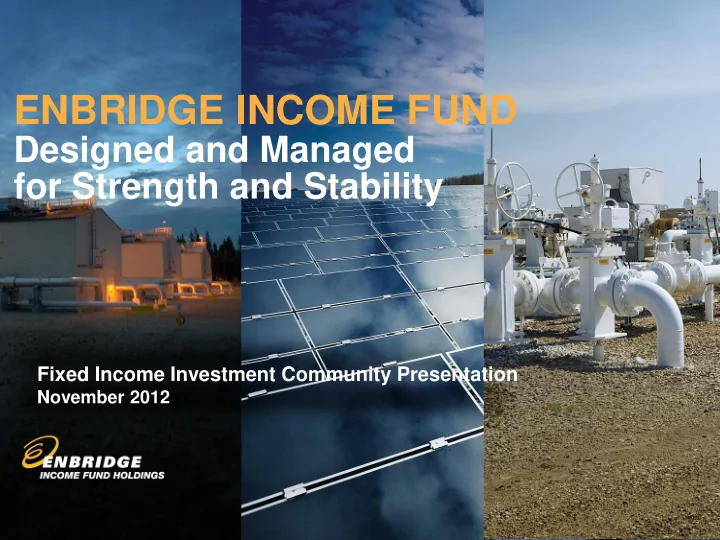
ENBRIDGE INCOME FUND
Designed and Managed for Strength and Stability
Fixed Income Investment Community Presentation
November 2012
ENBRIDGE INCOME FUND Designed and Managed for Strength and - - PowerPoint PPT Presentation
ENBRIDGE INCOME FUND Designed and Managed for Strength and Stability Fixed Income Investment Community Presentation November 2012 1 1 FORWARD LOOKING STATEMENTS This presentation includes certain forward looking information (FLI) to
1
1
Fixed Income Investment Community Presentation
November 2012
2
FORWARD LOOKING STATEMENTS
This presentation includes certain forward looking information (“FLI”) to provide Enbridge Income Fund Holdings Inc. (“EIFH”) shareholders and potential investors with information about EIFH and its investee, Enbridge Income Fund (the “Fund”), management's assessment of their future plans and operations, which may not be appropriate for other
"intend", "target", "believe" and similar words suggesting future outcomes or statements regarding an outlook. Although we believe that the FLI in this presentation is reasonable based on the information available today and the processes used to prepare it, such statements are not guarantees of future performance and you are cautioned against placing undue reliance on FLI. FLI inherently involves a variety of assumptions, known and unknown risks, uncertainties and other factors which may cause actual results, levels of activity and achievements to differ materially from those expressed or implied in our FLI and the FLI relating to the Fund. Material assumptions include: expected supply and demand for crude oil, natural gas and natural gas liquids; prices of crude oil, natural gas and natural gas liquids; expected exchange rates; inflation; interest rates; availability and price of labour and pipeline construction materials; operational reliability; customer project approvals; maintenance of support and regulatory approvals for the Fund’s projects; anticipated in-service dates and weather. Our FLI is subject to risks and uncertainties pertaining to operating performance, regulatory parameters, project approval and support, construction schedules, weather, economic conditions, exchange rates, interest rates and commodity prices, including but not limited to those discussed more extensively in our filings and the filings of the Fund with Canadian securities regulators. The impact of any one risk, uncertainty or factor on any particular FLI is not determinable with certainty as these are interdependent and the future course of action of EIFH and the Fund depends on management's assessment of all information available at the relevant time. Except to the extent required by law, neither EIFH nor the Fund assumes any obligation to publicly update or revise any FLI, whether as a result of new information, future events or otherwise. All FLI in this presentation is expressly qualified in its entirety by these cautionary statements. This presentation may make reference to certain financial measures, such as cash available for distribution, which are not recognized under GAAP. Reconciliations to the most closely related GAAP measures are included in the MD&A filings and/or Supplementary Financial Information available on our website or in the slides that accompany this presentation, if applicable.
3
INVESTOR VALUE PROPOSITION
DBRS: BBB (H) Moody’s: Baa2 Designed and Managed for Strength & Stability
4
– Maximize revenue, improve efficiencies , minimize costs
– Extend or expand existing assets
– From third party or from Enbridge Inc. – Target energy infrastructure with risk-return characteristics in keeping with the Fund’s current profile
CORE STRATEGIES
Core Strategies Remain Unchanged Post Restructuring and the 2011 Asset Drop Down From Enbridge Inc.
5
CURRENT ASSET BASE A Diversified Portfolio of Low Risk Energy Infrastructure
Business Segment Throughput Capacity Current Revenue Generation Model Primary Contract Term Expiry
Gas Transmission
1.6 Bcf/day
(1.325 Bcf/day firm service)
Cost of Service 2015
Crude Oil & Liquids Transportation
255,000 barrels/day 145,000 barrels/day Cost of Service Fixed Transportation Fee N/A 2023
Green Power
405 MW/Day Fixed Price PPA’s 2017 - 2031
5
6
NATURAL GAS TRANSMISSION Alliance Canada
Solid Fundamentals will Drive Alliance Re-Contracting Post 2015
Strategically Positioned to Gather Rich Gas Liquids Rich Shale Gas Production in Alliance Footprint
rich gas
rich gas premium
producers
Alliance’s Rich Gas Advantage Competitive toll on dry gas basis, before NGL value is considered $0.00 $1.00 $2.00 $3.00
Recontracting Proposal: Alliance plus Vector Current: Alliance plus Vector TC Restructured 2013 TC Status Quo 2013
per MMBtu
FTR (AB) NIT to TC TC to Dawn APL AB GZ APL TZ (Can) APL TZ (US) Vector
Examples all are: AB Receipt Point to Dawn
3 6 9 2010 2015 2020 2025 Bcf / d
Montney Duvernay Bakken
Current Firm Service (Tolled) Capacity - Alliance Canada Current Total Capacity - Alliance Canada
7
Assets are Performing Reliably and As Expected
GREEN POWER GENERATION
Diversified Portfolio
2012 Cash Flow Sensitivity
Asset Location Capacity Capacity Factor (P50) Capacity Factor (P75) Pre-Tax Cash Flow Impact (P75)
Ontario Wind Ontario 190 MW 30% 28% ~ $3 MM Talbot Wind Ontario 99 MW 35% 33% ~ $2 MM Sarnia Solar Ontario 80 MW 17% 16% ~ $3 MM Magrath Wind Alberta 30 MW 36% 34% Immaterial Chin Chute Wind* Alberta 30 MW 38% 36% Immaterial Sunbridge Wind Saskatchewan 11 MW 39% 37% Immaterial 2012 YTD CAFD Q1 Q2 Q3 YTD Actual Acquisition Assumption
8
Recent & Planned Expansion
Capacity Increase Capital Costs In-Service
Phase 1 98,000 bpd $36 M 2007 Phase 2 125,000 bpd ~$158 *M 2010 BEP 145,000 bpd ~$190* M 2013
*estimated costs
CRUDE OIL & LIQUIDS TRANSPORTATION
Bakken Production Drives New Investment & Long-Term Growth
Bakken Expansion Program (BEP) System Toll Methodology Regulator
Westpur Cost of Service Formula NEB Saskatchewan Gathering Cost of Service Formula Saskatchewan Weyburn Market Based Saskatchewan Virden Market Based Manitoba BEP Long - Term Contract NEB
8
500 1,000 1,500 2,000 2012 2013 2014 2015 2016 2017 2018 2019 2020 2021 2022 ‘000 barrels per day
Total Bakken Production
(North Dakota, Saskatchewan and Manitoba)
9
The acquisition is consistent with the Fund’s strategy and investor value proposition
RECENTLY ANNOUNCED TRANSACTION
On October 25, 2012, Enbridge Income Fund announced that it had entered into an agreement to acquire a portfolio of renewable power generation and crude oil storage assets from Enbridge Inc. for an aggregate price of $1.164 billion. The acquisition remains subject to approval of the public (non-Enbridge) shareholders of Enbridge Income Fund Holdings Inc. and other regulatory consents. Shareholder approval will be sought at a meeting to be held December 7, 2012 and, if approved, the transaction would close shortly thereafter.
10
RECENTLY ANNOUNCED PENDING ASSET ACQUISITION TRANSACTION
Proposed Asset Acquisition Reinforces the Fund’s Low Risk Profile
Asset Capacity Contract Structure Remaining Contract Life
Hardisty Contract Terminals 7.5 millions barrels (19 above ground tanks) Fully Contracted (take-or- pay), 80% of revenue 2-9 years + Additional 15 years with Enbridge Hardisty Storage Caverns 3.5 million barrels (4 below ground caverns & 2 above ground tanks) Fully Contracted (take-or- pay) ~8 years + Additional 15 years with Enbridge Greenwich Wind Project 99 MW Fixed Price OPA PPA 19 years Amherstburg Solar Project 15 MW Fixed Price OPA PPA 19 years Tilbury Solar Project 5 MW Fixed Price OPA PPA 18 years
TOTAL ~ 100% 20+ years
Fort St. John Fort McMurray Edmonton Montreal Ottawa Toronto Calgary Regina Cromer
Wind Project Solar Project Waste Heat Facility
Alliance Canada Pipeline (50%) Chin Chute (33%) Magrath (33%) SunBridge (50%)
Greenwich Hardisty Storage Caverns Hardisty Contract Terminals
Saskatchewan Crude Oil Pipeline System Kincardine Sarnia Talbot
Tilbury Amherstburg
11
RECENTLY ANNOUNCED TRANSACTION
Credit Perspective
Long Term fixed price take-or-pay/fee for service off take contracts Strong, investment grade counterparties Fixed price O&M contracts Minimal maintenance capex requirements Further diversifies asset base and sources of cash flow Enhances scale Extends average term of contracted assets Reinforces low risk value proposition Accretive to cash flow
BBB(H) Rating Re-Affirmed Portfolio of High Quality, Operating Assets …
12
Conservative Leverage Given Underlying Business Risk v
Term Loan Refinancing: TBD ECT Preferred Units: $305 Million
Public Shareholders
EIFH Common Shares: $55 Million EIFH Common Shares: $222 Million
(Subscription Receipts issued Nov 14, 2012)
EIF Common Units: $277 Million
Equity Financing (50%): $582 Million Debt Financing (50%): $582 Million
10-Year Pre-Payable Term Loan: $582 Million
RECENTLY ANNOUNCED TRANSACTION
Financing Plan
13
INVESTMENT CONSIDERATIONS:
Attractive & Increasingly Diversified Business Mix Proforma 2012 Pre Transaction 2012E Inception - 2003
48% 25% 27% 88% 12%
EBITDA ~$100M EBITDA ~$200M EBITDA >$300M
Natural Gas Transmission Green Power Crude Oil Transportation & Storage
15% 47% 38%
EBITDA = earnings before interest, taxes, depreciation and amortization generated by Natural Gas Transmission and Green Power plus distributions from Alliance Canada and all other equity investees, all before deduction of corporate level expenses.
14
INVESTMENT CONSIDERATIONS:
Low Risk Commercial Structures
Source: Enbridge Income Fund Management Estimates & Canadian Investment Dealer Analysis EBITDA = earnings before interest, taxes, depreciation and amortization generated by Natural Gas Transmission and Green Power plus distributions from Alliance Canada and all other equity investees, all before deduction of corporate level expenses.
EIF Post Transaction EIF Pre Transaction
Cost of Service/Take or Pay Fee for Service/Volume Risk Margin Based Commodity Exposure
Peer 1 Peer 2 Peer 3 Peer 4 Peer 5 Peer 6
15
– After reserving for contingencies and debt amortization – Smoothed dividend payout at EIFH
– In keeping with asset risk profile – Target DEBT/EBITDA: 3.5x - 4.5x
– Enhanced access to capital markets – Maintenance of strong credit ratings: BBB(H) & Baa2
– Minimize exposure to market price movements and counterparty default
INVESTMENT CONSIDERATIONS:
Prudent Financial Management
16
INVESTMENT CONSIDERATIONS:
Minimized Financial Risk
$0 $20 $40 $60 $80 $100 $120 $140 $160 $180 $200
Market Price Risk
< 1% CFaR Cash flow at Risk (CFaR**)
* Foreign Exchange, Interest Rate & Commodity **CFaR – Measures the maximum cash flow loss that could result from adverse market price movements over a 12 month period within 97.5% confidence level (1.96 std. deviations) under normal market conditions .
Counterparty Credit Risk
Receivable by Counterparty Credit Quality
Market Price* and Counterparty Risks Have Been Substantially Mitigaged
Investment Grade Security Received
17
INVESTMENT CONSIDERATIONS:
Growing Liquidity and Attractive Relative Value Public Debt Float/Issuances Increasing
$0 $100 $200 $300 $400 $500 $600
Term Debt Issuances Large Yield Premium Relative to Other Enbridge Issuers
50 100 150 200 250 EPI EGD EI EIF
Indicative 10 yr Spreads
bps
Increased Liquidity Across Maturity Spectrum
18
INVESTMENT CONSIDERATIONS:
Strong Sponsorship
– Enbridge Inc. retains a 68% economic interest in the Company
– Asset operations – Risk management systems and processes – Project construction management
– Enbridge is one of North America’s most successful developer of energy infrastructure – Over $42B in consolidated assets; $18B+ in secured projects (2012 – 2016)
ENF benefits from Ownership and Expertise of Enbridge Inc.
19
INVESTMENT SUMMARY Designed and Managed for Strength and Stability
Pending Acquisition will Further Reinforce the Low Risk Value Proposition
DBRS: BBB (H) Moody’s: Baa2
21
22
Above Ground Storage Details
Location Hardisty, Alberta Capacity Approximately 7.5 million barrels Revenue Agreements through years 17 - 24 Existing contracts at existing contract rates. Once the HCT principal storage contracts expire, Enbridge will contract with the purchaser for an additional 15 years. Pricing based on the final year rate of the existing contract inflated at 2% per year thereafter. Post HCT 15 Year Enbridge Contract through years 32 - 39 Enbridge renewal option. Pricing based
Enbridge Contract inflated at 1% per year thereafter.
Land Leases
All land owned by Enbridge Midstream Inc. In Service 2009
Hardisty Contract Terminal
Athabasca Athabasca Pipeline Waupisoo Pipeline Edmonton Hardisty
Express
Hardisty Contract Terminal
Low Risk Business Model Long Term Take or Pay Contract
23
Storage Caverns Details
Location Hardisty, Alberta Capacity Approximately 3.5 million barrels Revenue Agreements through year 23 Existing contracts at existing rates. Once the HSC Principal Storage Contract expires, Enbridge will contract with the purchaser for an additional 15 years. Pricing based on the final year rate of the existing contract inflated at 2% per year thereafter. Post HSC 15 Year Enbridge Contract through years 24 - 38 Enbridge renewal option. Pricing based
Enbridge Contract inflated at 1% per year thereafter.
Land Leases
North, South & East Terminal land
West cavern under long-term lease In Service 2003
Hardisty Storage Caverns
Athabasca Athabasca Pipeline Waupisoo Pipeline Edmonton Hardisty
Express
Hardisty Storage Caverns
Low Risk Business Model Long Term Take or Pay Contract
24
Project Details
Location West shores of Lake Superior – near Thunder Bay Capacity (AC) 99MW Capacity Factor 33.2% Technology 43 Siemens SWT-2.3-101 turbines O&M Contract 5-year fixed price comprehensive service, maintenance and warranty agreement Energy Purchaser 20 year OPA Contract PPA Prices Consent Pending Land Leases 25-year fixed term Crown land lease with a 15 year renewal option In Service October 2011 Expansion Opportunities 55 MW potential
Greenwich Wind Project
Low Risk Business Model In Operation with Long Term Take or Pay Contract
25
Kincardine
Amherstburg Project Tilbury Project
Project Details
Amherstburg
Tilbury
Location Southwestern Ontario Near Tabot Wind Farm Capacity (AC) 15 MW – Two adjacent farms: 10 MW & 5 MW 5 MW Capacity Factor 18.1% 17.8% Technology Thin Film (First Solar) Thin Film (First Solar) O&M Contract First Solar – 10 year agreement (Enbridge
another 10 years) First Solar – 10 year agreement (Enbridge
another 10 years) Energy Purchaser OPA Standard Offer Contracts (20-year) OPA Standard Offer Contracts (20-year) PPA Prices $420/MWh $420/MWh Land Leases 25 year lease (20 year extension) Fee Simple In Service August 2011 December 2010
Amherstburg & Tilbury Solar Projects
Low Risk Business Model In Operation with Long Term Take or Pay Contracts
26
CORPORATE STRUCTURE
Post Acquisition
Through its investment in Enbridge Income Fund Holdings and its common and preferred interest in Enbridge Income Fund, Enbridge Inc. owns 67.8% economic interest in the Fund.
80.1% 19.9% 84.5%
Liquids Assets Alliance Pipeline Green Power
15.5%
Bank Debt Medium Term Notes
27
3-10 Years 2 Price Tiers Fixed Rates 1-10 Years 3 Price Tiers Fixed Rates
FDS FT-1 FRS
1-10 Years 3 Price Tiers Negotiated Fixed Rates
Canada U.S.
3-10 Years Negotiated Index Based Rates
FDS
Canada U.S.
FT-1 FT-1
3-10 Years 2 Price Tiers Negotiated Fixed Rates
Segmented Index Based Full Path
Title Transfer
$/GJ $/Mcf $/Mcf 3-10 Years Negotiated Index Based Rates $/GJ $/Dth $/Dth $/Mcf Chicago Hub
Energy tolls converted @ fixed 41MJ/m3 (1,100 Btu/cf)
Chicago Hub 3-10 Years 2 Price Tiers Fixed Rates
FT-1C
Canada U.S.
Chicago Hub
ATP
A Variety of Services & Toll Options to Suit Customers Needs
ALLIANCE PIPELINE CANADA
New Services Framework