
16/02/2017 1
Distribution of Income (Wealth) and Ginis around the World, Brazil (& Latin America)
Marcelo Neri FGV Social/CPS and EPGE/FGV *Reference: Milanovic (2016) “Global Inequality” Chapter 1 *Video Milanovic Peterson Institute from 3:20 to 26:25 minutes ://www.youtube.com/watch?v=zt8h0GC2KdY ***discussion Milanovic and Piketty Paris School of Economics - first 20 minutes https://www.youtube.com/watch?v=-PcdQld7Rww Obs: *means obligatory reference ***suggested optional reference
*7 Social Economics and Public Policy – Marcelo Neri
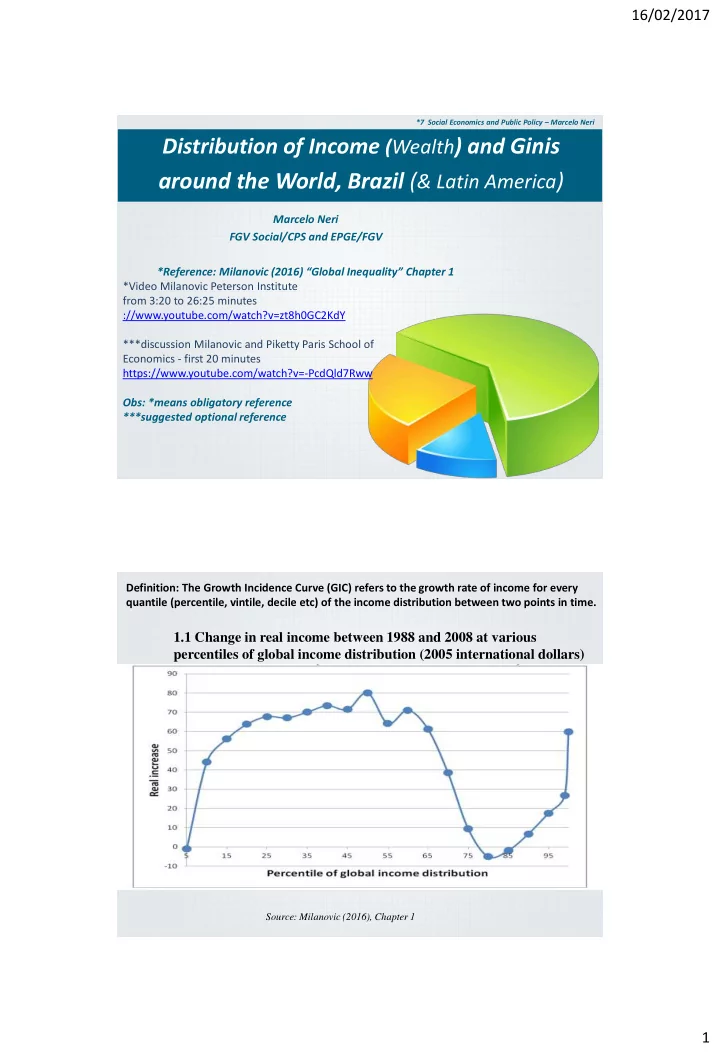
Source: Milanovic (2016), Chapter 1
1.1 Change in real income between 1988 and 2008 at various percentiles of global income distribution (2005 international dollars)
Definition: The Growth Incidence Curve (GIC) refers to the growth rate of income for every quantile (percentile, vintile, decile etc) of the income distribution between two points in time.