
SLIDE 1
DISCLAIMER This Investor Presentation has been prepared by Valuewise - - PowerPoint PPT Presentation
DISCLAIMER This Investor Presentation has been prepared by Valuewise Investor Relations LLP in consultation with Lancer Container Lines Ltd. and does not constitute a prospectus or placement memorandum or an offer to acquire any securities. This
This Investor Presentation has been prepared by Valuewise Investor Relations LLP in consultation with Lancer Container Lines Ltd. and does not constitute a prospectus or placement memorandum or an offer to acquire any securities. This presentation or any other documentation or information (or any part thereof) delivered or supplied should not be deemed to constitute an offer . No representation or warranty, express or implied is made as to, and no reliance should be placed on, the fairness, accuracy, completeness or correctness of such information or opinions contained herein. The information contained in this presentation is only current as of its date. Certain statements made in this presentation may not be based on historical information or facts and may be “forward looking statements”, including those relating to the general business plans and strategy of Lancer Container Lines Ltd its future financial condition and growth prospects, future developments in its industry and its competitive and regulatory environment, and statements which contain words or phrases such as ‘will’, ‘expected to’, ‘horizons of growth’, ‘strong growth prospects’, etc., or similar expressions or variations of such expressions. These forward- looking statements involve a number of risks, uncertainties and other factors that could cause actual results, opportunities and growth potential to differ materially from those suggested by the forward-looking statements. Further, no representation or warranty expressed or implied is made nor is any responsibility of any kind accepted with respect to the completeness or accuracy of any information. Also, no representation or warranty, express or implied, is made that such information remains unchanged in any respect as of any date or dates after those stated herein with respect to matters concerning any statement made in this Investor Presentation. Lancer Container Lines Ltd may alter, modify or otherwise change in any manner the content of this presentation, without obligation to notify any person of such revision or changes. This presentation cannot be copied and disseminated in any manner. No person is authorized to give any information or to make any representation not contained in and not consistent with this presentation and, if given or made, such information or representation must not be relied upon as having been authorized by or on behalf of Lancer Container Lines Ltd. This presentation is strictly confidential. The earlier versions of this presentation, were in draft form, and should not be circulated or referred to by anyperson.
MBA in Shipping from Adams Smith University of America and Diploma in Export-Import Management (India). He is current President on the board
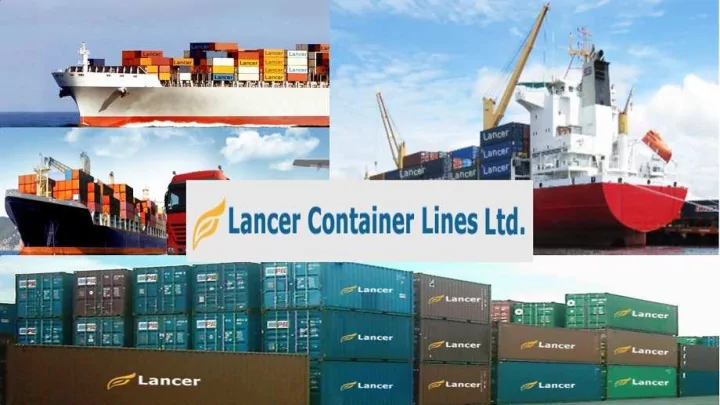
Container Lines with the vision of making it a leader in Logistics. Rapidly growing the company now has approx. 8000 plus containers as on end of H1FY2019.
2011-12
Division and Container Yard
for Container Yard
Forwarding & Inland Transportation
Mumbai on 7th March, 2011 & Gujarat on 1st May 2012 2013-14
Towers in CBD Belapur
started
branch in Delhi on 1st Nov, 2014 2015-16
Kolkatta on 1st June, 2015 & at Tuticorin, Ludhiana & Chennai in 2016
platform of BSE exchange raising Rs.1.84 Crores with issue of 15,40,000 shares of Rs.10 face value @ premium of Rs. 2.00
Leasing 2017
branch in Jaipur on 15th June, 2017, at ViZag on 8th Aug, 2017 & at Ahmedabad
2017 2018
Board on BSE.
Belapur
branch in Hydrebad on 21st Nov, 2018
Services Detailed description
Non Vessel Operating Common Carrier (NVOCC)
Non Vessel operating common carrier means a cargo consolidator who does not own any vessel, but acts as a carrier legally by accepting required responsibilities of a carrier who issues his own bill of lading.
Freight Forwarding
Here we act as an intermediary between the client and various transportation services.
Container trading & leasing
Purchase and sale of containers.
Empty container yard
Our Yard is located at Panvel and spread over 20,000 square meters and mainly for storage of empty containers. Others: We may also provide container maintenance, refurbishment, repairs, container cleaning and decontamination.
Transportation
Selectively offered.
4 3 2 1 5 6 7 8 9
10
11 12 13 14 15 16 17 18 Enquiry from shipper for respective location Customer Service will take KYC & give rates Rate & booking confirmation Shipper will send DO release request Customer service will issue Container Release Order Lifting of container by Shipper’s transporter from empty yard Shipper will take container to stuffing point (e.g. Factory) Shipper will gate in container into the port, deliver shipping bill & load list to Surveyor & us Surveyor will file EGM with Customs Department The Load list confirmation will be sent by Feeder Operator Terminal Departure Report will be issued by us to POD Container will be loaded
Post payment, Shipper will approach us for Bill
Shipper will send original Bill
Lading to his consignee at port
destination On arrival of vessel at POD, Consignee will approach our Agent Once cargo is de-stuffed, empty container will be delivered to Agent’s yard at POD Consignee will take delivery of Cargo Post receipt of Original Bill of Lading & payment, agent will release DO
Cargo arrives at destination (Port of Discharge). Cargo Arrival notice (CAN) is issued to Consignee. Consignee approaches Lancer agent office for Delivery order (DO). DO is issued
producing
Bond and undertaking by consignee. Destination charges collected from consignee. Empty container returned by consignee to Yard. Lancer agent surveys container for damages. Bond is released if container is free of damages, else repair and refurbishing charges collected.
@ Port of loading (POL) @ Port of discharge (POD)
NVOCC (FY18 REVENUE Rs.102.13 Crores) CONTAINER TRADING (FY18 REVENUE Rs.5.56 Crores) SHIPPING & FREIGHT FORWARDING (FY18 REVENUE Rs.1.32 Crores) Note: Other (FY18 REVENUE Rs.1.76 Crores) EMPTY CONTAINER YARD
0.00 20.00 40.00 60.00 80.00 100.00 120.00 FY14 FY15 FY16 FY17 FY18 22.16 30.42 43.14 79.34 110.71
Total Revenue
0.00 2.00 4.00 6.00 8.00 10.00 12.00 14.00 16.00 FY14 FY15 FY16 FY17 FY18 1.87 3.83 6.06 7.85 15.24
EBITDA
0.00 1.00 2.00 3.00 4.00 5.00 6.00 7.00 FY14 FY15 FY16 FY17 FY18 0.44 0.42 0.55 1.68 6.84
PAT
2.00 4.15 6.42 9.94 18.87 0.00 5.00 10.00 15.00 20.00 FY14 FY15 FY16 FY17 FY18
Networth
8.46% 12.58% 14.05% 9.89% 13.77% 0.00% 2.00% 4.00% 6.00% 8.00% 10.00% 12.00% 14.00% 16.00% FY14 FY15 FY16 FY17 FY18
EBITDA Margin
1.99% 1.38% 1.28% 2.11% 6.18% 0.00% 1.00% 2.00% 3.00% 4.00% 5.00% 6.00% 7.00% FY14 FY15 FY16 FY17 FY18
PAT Margin
Particulars FY18 FY17 FY16 FY15 FY14 INCOME Revenue from Operations 109.44 77.60 43.13 30.42 22.14 Other income 1.26 1.75 0.01 0.01 0.02 Total revenue 110.71 79.34 43.14 30.42 22.16 EXPENSES Cost of material consumed 87.60 63.68 33.04 0.00 0.00 Purchase of stock in trade 0.00 0.00
2.56 6.70 Changes in inventories 0.00 0.91 0.00 0.00
Employee benefit expenses 4.43 3.73 3.62 2.21 1.61 Other expenses 3.44 3.17 1.87 21.83 14.88 Total Expenses 95.47 71.49 37.08 26.60 20.29 EBITDA 15.24 7.85 6.06 3.83 1.87 Depreciation and amortization expenses 4.56 4.15 3.65 1.99 0.67 EBIT 10.68 3.70 2.41 1.84 1.20 Interest 1.42 1.65 1.63 1.22 0.56 EBT 9.26 2.05 0.77 0.62 0.64 Tax expense: (i) Current tax 2.65 0.09 0.30 0.30 0.22 (ii) Deferred tax 0.00 0.29
(iii) MAT Credit
0.00 0.00 0.00 0.00 PAT 6.84 1.68 0.55 0.42 0.44
(Rs. Crores)
Particulars FY18 FY17 FY16 FY15 FY14 Equity & Liabilities Shareholders’ funds
10.05 5.71 4.17 3.29 1.47
8.82 4.23 2.25 0.86 0.53 Total Shareholders fund 18.87 9.94 6.42 4.15 2.00 Minority Interest 0.00 0.86 Non-current liabilities
13.71 16.02 16.11 10.73 6.33
0.08 0.09 0.00 0.00 0.00
0.03 0.06 0.00 0.00 0.04 Current liabilities
0.04 0.13 1.12 0.90 0.22
8.61 5.91 5.76 3.32 4.38
11.15 7.59 3.64 2.95 4.12
0.00 0.00 1.37 0.66 0.00 T O T A L 52.49 40.61 34.42 22.70 17.09 Non-current assets
(i) Tangible assets 35.23 27.85 25.99 18.18 7.06 (iii) Capital Work-in-progress 2.78 0.00 0.00 0.00 0.00
0.00 0.00 0.20 0.13 0.02
0.04 0.00 0.19 0.00 0.18 Current assets
0.00 0.91 1.44 0.00 3.69
0.55 0.00 0.00 0.00
7.39 6.16 2.47 2.08 3.79
4.58 4.48 2.63 1.22 0.52
1.93 1.20 0.36 0.42 0.99
0.00 0.00 1.14 0.67 0.85 T O T A L 52 49 40 61 34 42 22 70 17 09
(Rs. Crores)
Particulars FY18 FY17 FY16 FY15 FY14 Net Profit before tax 6.84 1.68 0.77 0.62 0.64 Adjustment For: Depreciation & Amortisation Expense 4.56 4.15 3.65 1.99 0.67 Provision for taxation 0.00 0.00
0.00 0.00 (Profit)/loss on sale/ write of assets 0.00
0.38 0.03 0.00 Finance costs 1.42 0.00 0.00 1.21 0.44 Interest Income
0.00 0.00
0.00 Current year income tax 2.65 0.09 0.00 0.00 0.00 Operating profit before working capital changes 14.57 6.18 4.51 3.84 1.75 Adjusted for (Increase)/ Decrease in: Inventories 0.91 0.52 0.00 3.69
Trade receivables
0.00 1.41
Short-term loans and advances
0.00 0.86
Non-current Assets
0.29 0.00
Trade Payables 3.61 2.51 0.05 0.04 1.45 Other current liabilities 3.56
3.85 0.00 0.00 Increase in Current Assets 0.00 0.00
0.00 0.00 Cash generated from operations 17.73 6.21 6.15 8.59
Net Cash flow from operating activities (A) 17.73 6.21 6.15 8.29
capital expenditure on fixed assets, including capital advances
Proceeds from sale of fixed assets 0.00 1.93 1.19 0.03 0.00 Interest Income 0.24 0.00 0.00 0.01 0.00 investment in mutual funds
0.00 0.00 0.00 0.00 Net cash flow from investing activities
Proceeds from issue of shares and Debentures 0.57 2.40 1.72 1.68 0.95 Proceeds from issue of shares at Premium 0.76 0.31 0.00 0.00 0.00 Proceeds from Long-term/Short-term Borrowings 0.00
0.00 5.08 4.31 Repayment of Long-term borrowings
0.00 5.38 0.00 0.00 Finance cost
0.00 0.00
Net cash flow from financing activities
1.63 7.10 5.54 4.82 Net Increase/(Decrease) In Cash & Cash Equivalents (A+B+C) 0.09 1.85 1.41 0.70 0.40 Cash equivalents at the beginning of the year 4.48 2.63 1.22 0.51 0.11 Cash equivalents at the end of the year 4.57 4.48 2.63 1.22 0.51
(Rs. Crores)
Details (Consolidated) 1HFY19 Q2 FY19 FY18 FY17 FY16 FY15 FY14 Revenue (In Cr.) 79.57 43.98 110.71 79.34 43.14 30.42 22.16 EBITDA (In Cr.) 9.45 5.46 15.24 7.85 6.06 3.83 1.87 EBITDA MARGIN % 11.88% 12.41% 13.77% 9.89% 14.05% 12.58% 8.46% PAT (In Cr.) 4.16 2.47 6.84 1.68 0.55 0.42 0.44 PAT MARGIN % 5.22% 5.61% 6.18% 2.11% 1.28% 1.38% 1.99% ROCE
32.79% 14.26% 10.68% 12.36% 14.43% RONW
36.25% 16.87% 8.57% 10.13% 22.04% Fixed Asset Turnover
3.14 2.85 1.66 1.67 3.14 Current Ratio
0.73 0.94 0.68 0.56 1.13 Debt/Equity x
0.73 1.63 2.69 2.81 3.59
Registered Office: Mayuresh Chambers Co-Op Society Ltd, Unit
Sector-11, CBD Belapur, Navi Mumbai-400614