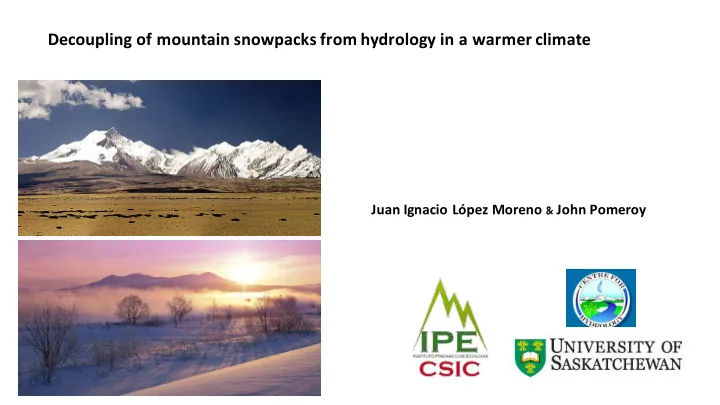
SLIDE 1
Juan Ignacio López Moreno & & John Pomeroy
Decoupling of mountain snowpacks from hydrology in a warmer climate
SLIDE 2
but It has been observed that snowpack and hydrology respond very differently to warmer temperatures in different parts of the world. The links between snow regime and hydrological sensitivity to temperature warming are not well understood yet. Temperature warming is the most certain consequence of human emissions of greenhouse gases “The largest changes in the hydrological cycle due to warming are predicted for the snow-dominated basins of mid- to higher latitudes, because adding or removing snow cover fundamentally changes the snow pack's ability to act as a reservoir for water storage” (Barnett et al. 2005) TEMPERATURE INCREASE LESS SNOW ALTERED RIVER REGIMES REDUCED SPRING FRESHEET
SLIDE 3
Snowpack sensitivity to global warming
SLIDE 4 Difficulties:
- Difficult to relate observed changes in snowpack with temperature because other meteorological (radiation, relative
humidity, etc), topographical (elevatio, slope, aspect) and environmental (vegetation cover, presence of water, etc) infer the temporal evolution of snowpack.
- Need to work with physicalled based SEB models and conduct sensitivity analyses
- Few observations (and normally short and incomplete series) to run SEB (automathic weather stations). Analyses
cannot be conducted in many mountainous areas of the world.
- Even more complicated for hydrologicalsensitivity: Many factors affect the hydrological response and they difficult
disentangling the role of temperature Snowpack and hydrologicalsensitivity to global warming
SLIDE 5 Snowpack and hydrologicalsensitivity to global warming Difficulties:
- Difficult to relate observed changes in snowpack with temperature because other meteorological (radiation, relative
humidity, etc), topographical (elevatio, slope, aspect) and environmental (vegetation cover, presence of water, etc) infer the temporal evolution of snowpack.
- Need to work with physicalled based SEB models and conduct sensitivity analyses
- Few observations (and normally short and incomplete series) to run SEB (automathic weather stations). Analyses
cannot be conducted in many mountainous areas of the world.
- Even more complicated for hydrologicalsensitivity: Many factors affect the hydrological response and so difficult to
disentangling the role of temperature
SOLUTION: : VIRTUAL BASIN + + REANALISIS DATA
SLIDE 6 1000 mts 7 HRUs 1: Summit 2 High elevation plateau 3: Upper North 4: Upper South 5: Lower North 6: Lower South 7: Bottom
Little role of vegetation with bare terrain at the higher HRUs and grasslands at the lower elevations No groundwater recharge and limited soild water storage retention (thin soils at higher HRUs and no more than 1 meter at the lower elevations) Elevation of the basin to ensure the existence of seasonal snowpack but avoiding formation
glaciers
44 VIRTUAL BASINS
SLIDE 7 REANALYSIS AS INPUT data
Temperature Precipitation Incoming solar radiation Air pressure Wind speed Air humidity
- 1. Bias corrected ERA-40 Reanalysis
Bias corrected ERA-40 Reanalysis 0.5º spatial resolution 3 hours time step 1980-2012
- 2. Download data of the pixel containing the coordinates of the target
mountain area (INARCH sites or selected mountains in the world)
- 3. Using CRHM for scaling inputs from elevation of the WATCH data centroid to
the elevation, slope and aspect of each HRU of the virtual basin
- 4. Using CRHM for simulating snow water equivalent, energy balance
components and the basin runoff output The aim is not having data that reproduces exactly the conditions of each point, but to ensure we are using coherent inputs gathering much of the climates found in snow dominated basins in the world
SLIDE 8 Sensitivity analysis
Run of CRHM simulations at each virtual basin for control conditions and T+1ºC, T+2ºC, T+3ºC, T+4ºC, T+5ºC Propose indices to represent the snow and hydrological regimes Sensitivity per ºC: (ΔΤ1+ 1+ ΔΤ2+ 2+ ΔΤ3+ 3+ ΔΤ4+ 4+ ΔΤ5) 5)/5
31 days 100 mm (37%)
ΔΤ1 ΔΤ2 ΔΤ3 ΔΤ4 ΔΤ5
SLIDE 9
Questions
1- How sensitive are global mountain snow regimes and hydrology to changes in climate associated with increased air temperatures. 2- How do process interactions mediate sensitivity for snow regimes and for hydrology? 3- Will reduced snowpacks under global warming result in reduced streamflowgeneration?
SLIDE 10
Sensitivity of snowpack
Sensitivity (% ºC)
SLIDE 11
Sensitivity of Peak SWE Sensitivity of snow duration
Sensitivity of snowpack
SLIDE 12
Sensitivity of snowpack
Sensitivity of snowfall/precipitation ratio versus its sensitivity
Ratio snowfall (Current) Sensitivity ratio snowfall (% ºC)
SLIDE 13
Sensitivity duration Sensitivity PeakSWE
Sensitivity of snowpack
Sensitivity of Peak SWE versus sensitivity of snow duration
SLIDE 14
Sensitivity of snowpack
Sensitivity of Peak SWE versus temperature and vapour pressure
Mean temperature Mean vapour pressure Sensitivity of Peak SWE Sensitivity of Peak SWE
SLIDE 15
Sensitivity of snowpack
Sensitivity of Peak SWE versus temperature and vapour pressure
Mean temperature Mean vapour pressure Sensitivity of Peak SWE Sensitivity of Peak SWE Linear regression model r2= 0.81
SLIDE 16
Sensitivity of snowpack
Mean temperature Mean vapour pressure Sensitivity of snow duration Sensitivity of snow duration
Sensitivity of snow duration versus temperature and vapour pressure
Linear regression model r2= 0.55
SLIDE 17
Hydrological sensitivity
Variability of sensitivity for 3 hydrological indices
D50: Change in the day where the center of mass of the hydrograph occurs Sensitivity % ºC) Snow damming: Change in r value between monthly P and Q Ratio Snowmelt: Ratio between snowmelt and annual Q
SLIDE 18 0,5 1 1,5 2 2,5 3 50 100 150
r= 0.07 r= 0.86
Snow damming
Hydrological sensitivity
T0ºC T+5ºC
SLIDE 19
Hydrological sensitivity
Snow damming Ratio Snowmelt/Qannual D50
SLIDE 20
Sensitivity of snowmelt/Qannualversus sensitivity SWE peak and snow duration R=0.77 R=0.61
Hydrological sensitivity
Sensitivity ratio snowmelt/Qannual Sensitivity ratio snowmelt/Qannual Sensitivity Peak SWE Sensitivity snow duration
SLIDE 21
Hydrological sensitivity
Sensitivity of Snowdamming versus sensitivity SWE peak and snow duration Sensitivity Peak SWE Sensitivity snow damming R=0.55 Sensitivity snow duration Sensitivity D50 R=0.47
SLIDE 22
Hydrological sensitivity
Sensitivity of D50 (center of mass) ) versus sensitivity SWE peak and snow duration Sensitivity snow duration Sensitivity D50 R=0.58 Sensitivity snow duration Sensitivity D50 R=0.45
SLIDE 23
Hydrological sensitivity
Sensitivity of Qannual versus sensitivity SWE peak and snow duration Sensitivity Peak SWE Sensitivity snow duration Sensitivity Qanual R=0.32 R=0.61
SLIDE 24 SNOWPACK
- We found a very strong variability in snowpack sensitivity to increasing temperatures.
- Temperatureof the basin (distance to 0ºC isotherm) controls closely the precipitation phase and the sensitivity of Peak SWE.
- With temperatureand vapor pressure more than 80% of the variance of sensitivity of peak SWE is explained: Good predictability.
- Snow duration more difficult to be predicted from diagnosis variables.
HYDROLOGY
- As temperature will warm mountain´s runoff will be decoupled from snowpack regimes.
- The sensitivity of ratio of % of Qannual from snowmelt is closely linked Peak SWE runoff, so can be easily predicted.
- Indices related with the seasonal behaviour of river regimes (i.e. snow damming and D50) are less related with snowpack.
- sensitivity. Sensitivity of snow duration explains better the response of river regime changes to warming: Worse predictability.
- We have not found clear impact of warmer temperatures and less snow on annual runoff.
Conclusions
SLIDE 25 Conclusions
To keep in mind
- Sensitivity was calculated for T0ºC to T+5ºC, changing the range may introducechanges in the average sensitivity values.
- It is difficult to find good indices to define shifts in hydrological regimes because they are affeced by seasonal distribution of
precipitation.
- Real basins compared to ideal basins would introduce much more complexity in the hydrological response to warming: need of
especific simulations at each place.
- Annual runoff might be affected by declining snowpacks in basins with deeper soils or groundwater recharge.
- Temperatureis not the only variable that changes with the time and it is not necessarily the most important.
- Hypsometry matters
SLIDE 26 1000 mts
HYPSOMETRY MATTERS?
0.5 0.5 1.5 1.5
SLIDE 27
THANKS!! !!
SLIDE 28
Peak SWE Snow duration
20% 14% 17% 22% 23% 15% 13% 16% 19% 21%
Sensitivity of snowpack
Basin Upper N. Upper S. Lower N. Lower S. Basin Upper N. Upper S. Lower N. Lower S.