debt levels
play

Debt Levels The graph below shows the Commonwealths consolidated - PowerPoint PPT Presentation

Debt Levels The graph below shows the Commonwealths consolidated debt levels from 1992 to 2015, as provided by the Office of Management and Budget (OMB). Debt levels have stabilized throughout the last four years Commonwealth Debt - 1992 to


  1. Debt Levels 
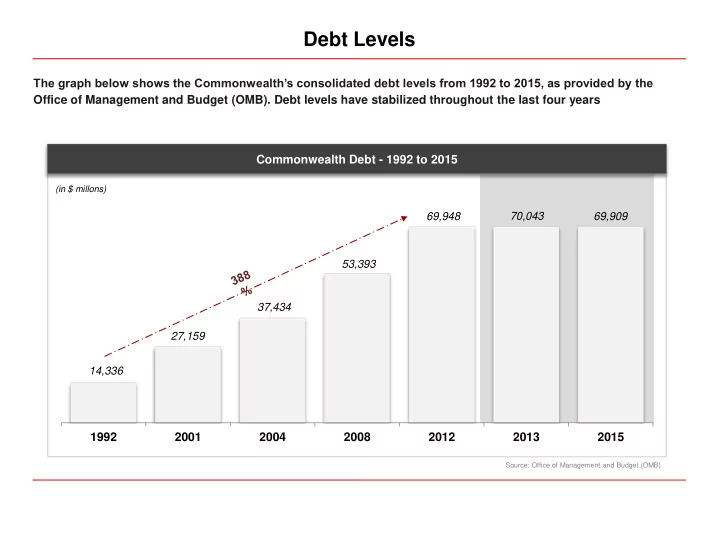
The graph below shows the Commonwealth’s consolidated debt levels from 1992 to 2015, as provided by the Office of Management and Budget (OMB). Debt levels have stabilized throughout the last four years Commonwealth Debt - 1992 to 2015 (in $ millons) 69,948 70,043 69,909 53,393 37,434 27,159 14,336 1992 2001 2004 2008 2012 2013 2015 Source: Office of Management and Budget (OMB)

  2. Employment in Manufacturing The graph below shows historic numbers on jobs in the manufacturing sector, as provided by the PR Department of Labor and Human Resources. Non-agricultural employment MANUFACTURING 158.7 157.6 155.4 155.6 154.5 154.7 153.8 159 147.6 144.1 142.7 131.8 121.1 118.2 118.3 115.3 EMPLOYMENT 109.7 -in thousands- 106.5 101 91.6 86.8 84.2 76.4 82 75.2 74.4 1990 1991 1992 1993 1994 1995 1996 1997 1998 1999 2000 2001 2002 2003 2004 2005 2006 2007 2008 2009 2010 2011 2012 2013 2014 2015 Source: DTRH Bureau of Labor Statistics YEAR Employment Statistics Division

  3. Historic Commonwealth Debt The graph below shows a historic overview of the Commonwealth’s consolidated debt levels from 1976 to 2016 80,000.0 70,000.0 60,000.0 50,000.0 In $ millions 40,000.0 30,000.0 20,000.0 10,000.0 0.0 1976 1977 1978 1979 1980 1981 1982 1983 1984 1985 1986 1987 1988 1989 1990 1991 1992 1993 1994 1995 1996 1997 1998 1999 2000 2001 2002 2003 2004 2005 2006 2007 2008 2009 2010 2011 2012 2013 2014 2015 2016 Source: Government Development Bank for Puerto Rico (GDB) Note: The Commonwealth’s historic consolidated debt levels include central government, public corporations and municipalities’ d ebt. This graph does not include Commonwealth non-recourse debt.

  4. Most Recent Debt Levels The graph below shows the Commonwealth’s consolidated debt levels throughout the last five years. Debt levels have stabilized during this Administration 75,000,000 72,266,730 71,116,959 68,929,335 70,000,000 70,043,049 69,214,047 69,947,888 In $ millions 65,000,000 60,000,000 55,000,000 50,000,000 Jun-12 Jun-13 Jun-14 Jun-15 Dec-15 Mar-16 Source: GDB Note: The Commonwealth’s historic consolidated debt levels include central government, public corporations and municipalities’ d ebt. This graph does includes Commonwealth non-recourse debt.

  5. Historic Commonwealth Debt The graph below shows a historic overview of the Commonwealth’s consolidated debt levels from 1976 to 2016 80,000.0 70,000.0 60,000.0 50,000.0 In $ millions 40,000.0 30,000.0 20,000.0 10,000.0 0.0 1976 1977 1978 1979 1980 1981 1982 1983 1984 1985 1986 1987 1988 1989 1990 1991 1992 1993 1994 1995 1996 1997 1998 1999 2000 2001 2002 2003 2004 2005 2006 2007 2008 2009 2010 2011 2012 2013 2014 2015 2016 Source: Government Development Bank for Puerto Rico (GDB) Note: The Commonwealth’s historic consolidated debt levels include central government, public corporations and municipalities’ d ebt. This graph does not include Commonwealth non-recourse debt.

Download Presentation
Download Policy: The content available on the website is offered to you 'AS IS' for your personal information and use only. It cannot be commercialized, licensed, or distributed on other websites without prior consent from the author. To download a presentation, simply click this link. If you encounter any difficulties during the download process, it's possible that the publisher has removed the file from their server.

Recommend


More recommend