Deal Activity - - 2006 2006 7,000 $80,000 Deal Activity $70,000 - - PDF document

deal activity 2006 2006
SMART_READER_LITE
LIVE PREVIEW

Deal Activity - - 2006 2006 7,000 $80,000 Deal Activity $70,000 - - PDF document

2007 Multifamily Market: Review and Assessment Aubrey L. Layne, Jr. President Great Atlantic Management GREAT ATLANTIC Deal Activity and Headlines Economic and Operating Environment Outlook HR Apartment Deal Volume and Price


slide-1
SLIDE 1

1

2007 Multifamily Market: Review and Assessment

Aubrey L. Layne, Jr. President Great Atlantic Management

GREAT ATLANTIC

  • Deal Activity and Headlines
  • Economic and Operating

Environment

  • Outlook

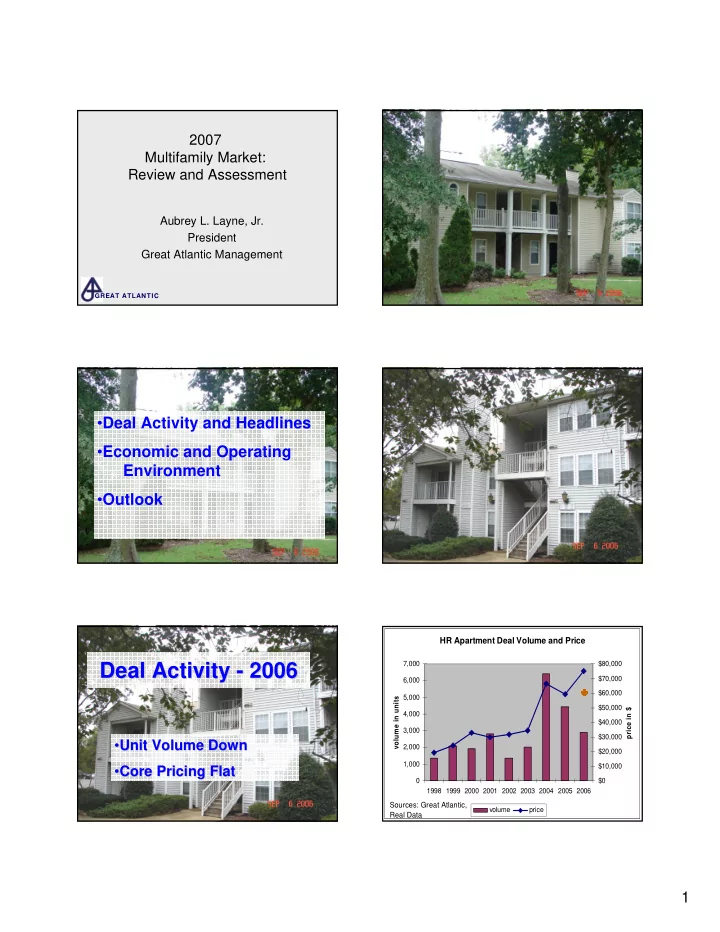
Deal Activity Deal Activity -

  • 2006

2006

  • Unit Volume Down

Unit Volume Down

  • Core Pricing Flat

Core Pricing Flat

HR Apartment Deal Volume and Price

1,000 2,000 3,000 4,000 5,000 6,000 7,000 1998 1999 2000 2001 2002 2003 2004 2005 2006 volume in units $0 $10,000 $20,000 $30,000 $40,000 $50,000 $60,000 $70,000 $80,000 price in $ volume price Sources: Great Atlantic, Real Data

slide-2
SLIDE 2

2

Biggest Deal in 2006

  • Alta Cove Now Empirian Chesapeake
  • $63 Million and $168,000 Per Unit

Bonaventure Group Enters HR

  • 702 Units in 2006
  • 540 Units in 2005

Economic and Operating Environment

slide-3
SLIDE 3

3

Apartment Cap Rates, Interest Rates and Spreads

1% 2% 3% 4% 5% 6% 7% 8% 9% 2 1 2 2 2 3 2 4 2 5 2 6 2 7 50 100 150 200 250 300 350 400 450 spread (bps) 10-Year Treasury avg cap rate spread (bps)

cap rates interest rates

spread

Sources: Capital Analytics, Federal Reserve

Renter's Monthly Cash Flow Advantage

$0 $200 $400 $600 $800 $1,000 $1,200 $1,400 $1,600 $1,800 2000 2001 2002 2003 2004 2005 2006 Hom e P&I and Rent $0 $100 $200 $300 $400 $500 $600 $700 $800 Renter's Advantage home P&I avg rent renter savings Sources: ODU, Real Data

Home Owner Vacancy

In Dwellings With 2 or More Units 2% 3% 4% 5% 6% 7% 8% 9% 10% 11% 9 2 9 3 9 4 9 5 9 6 9 7 9 8 9 9 1 2 3 4 5 6 Source: US Census Dept.

Employment

  • Ford Plant Closing
  • BRAC – 2008, Mostly on Peninsula
  • 2007 Unemployment 3.7%

HR Apartments Under Construction and Starts

500 1000 1500 2000 2500 3000 1 9 9 8 1 9 9 9 2 2 1 2 2 2 3 2 4 2 5 2 6 Apartm ent Units Under Construction Starts Source: Real Data

slide-4
SLIDE 4

4

HR Vacancy Rates and Rent Growth

0.0% 2.0% 4.0% 6.0% 8.0% 1 9 9 8 1 9 9 9 2 2 1 2 2 2 3 2 4 2 5 2 6 2 7 vacancy rent growth

Source: Real Data

HR Rent Growth and Core Inflation

0.0% 1.0% 2.0% 3.0% 4.0% 5.0% 6.0% 7.0% 8.0% 1998 1999 2000 2001 2002 2003 2004 2005 2006 HR Rent Growth Core Inflation Sources: US Dept. of Labor, Real Data

  • Buyers: Competitive Market
  • Sellers: Relatively High Prices
  • Owners: Positive Operating Environment
  • Renters: More Choice and Modestly

Higher Rents

Outlook - 2007