
SLIDE 1
CMPT 454, Simon Fraser University, Fall 2009, Martin Ester 29
Database Systems II Secondary Storage
CMPT 454, Simon Fraser University, Fall 2009, Martin Ester 30
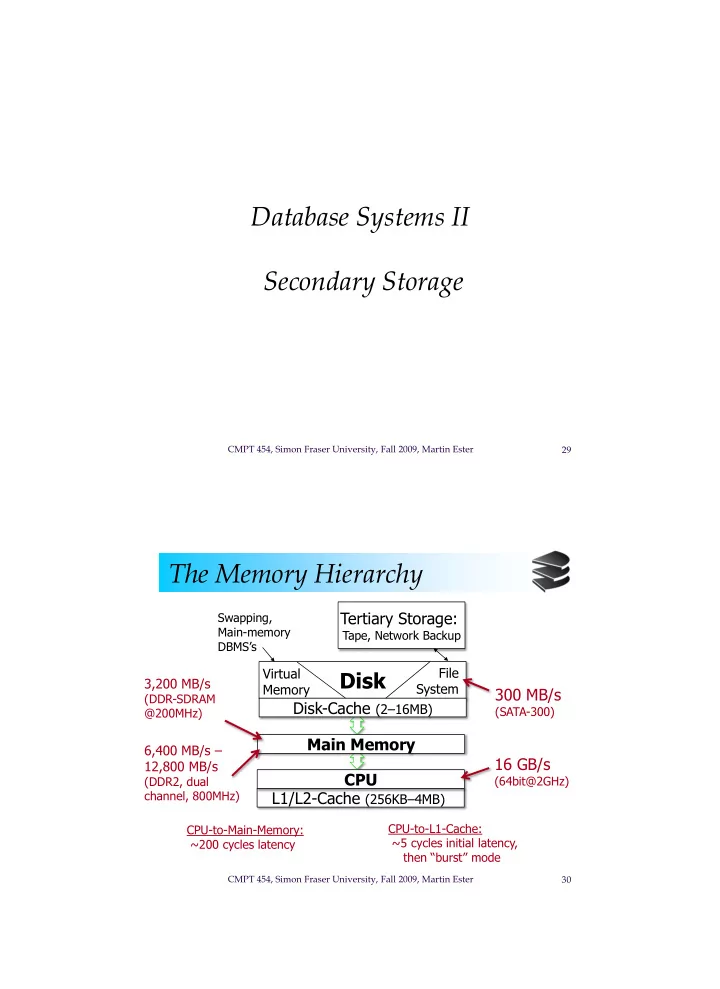
The Memory Hierarchy
Disk
Tertiary Storage:
Tape, Network Backup
Main Memory L1/L2-Cache (256KB–4MB) Disk-Cache (2–16MB) 300 MB/s
(SATA-300)
16 GB/s
(64bit@2GHz)
6,400 MB/s – 12,800 MB/s
(DDR2, dual channel, 800MHz) CPU-to-L1-Cache: ~5 cycles initial latency, then “burst” mode
CPU
Virtual Memory File System
CPU-to-Main-Memory: ~200 cycles latency
3,200 MB/s
(DDR-SDRAM @200MHz) Swapping, Main-memory DBMS’s