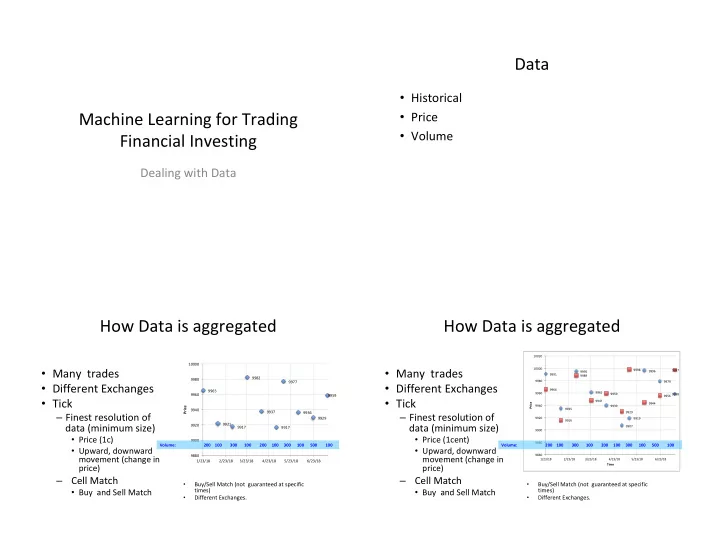
data
play

Data Historical Machine Learning for Trading Price Volume - PowerPoint PPT Presentation

Data Historical Machine Learning for Trading Price Volume Financial Investing Dealing with Data How Data is aggregated How Data is aggregated 10020 10000 Many trades Many trades 10000 9998 9997 9996 9995 9991 9989


  1. Data • Historical Machine Learning for Trading • Price • Volume Financial Investing Dealing with Data How Data is aggregated How Data is aggregated 10020 10000 • Many trades • Many trades 10000 9998 9997 9996 9995 9991 9989 9982 9980 9980 9977 9979 • Different Exchanges • Different Exchanges 9966 9965 9961 9960 9960 9959 9958 9959 9956 • Tick • Tick 9947 Price 9944 9940 Price 9939 9935 9940 9937 – Finest resolution of 9936 – Finest resolution of 9929 9929 9920 9919 9916 data (minimum size) 9921 data (minimum size) 9920 9907 9917 9917 9900 • Price (1c) • Price (1cent) 9900 9880 Volume: 200 100 300 100 200 100 300 100 500 100 Volume: 200 100 300 100 200 100 300 100 500 100 • Upward, downward • Upward, downward 9860 movement (change in 9880 movement (change in 1/23/18 2/23/18 3/23/18 4/23/18 5/23/18 6/23/18 1/23/18 2/23/18 3/23/18 4/23/18 5/23/18 6/23/18 price) price) Time – Cell Match – Cell Match • Buy/Sell Match (not guaranteed at specific • Buy/Sell Match (not guaranteed at specific times) times) • Buy and Sell Match • Buy and Sell Match Different Exchanges. Different Exchanges. • •

  2. Price anomaly • Lots of Data • Example 1: • Consolidate Data – Blue Line: – Time Epoch – What are the • Minute by Minute price drop here? • Hour by Hour • Daily – Open, Close – High, Low – Volume – Combine different exchanges Price anomaly Price anomaly Which makes most sense? • Example 2: – And here, what are q CEO Quit these price drops? q Dividend Cut q Stock Split

  3. Price anomaly Why do Stock Splits? • Price becomes to high: less liquid, less volume. • Buy in groups of 100 (typical) q CEO Quit – 50,000 for $500/stocks. • Exceptions/Why make an Exception? q Dividend Cut – Berkshire Hathaway BRK.A.(doesn’t split it q Stock Split shares). • Warren Buffet’s holding company. • >$110,000 (Volume : 450 shares per day) • Keeps the price high to deter short time traders • Next day 4 shares of creating excess volume. 75, 4x75=$300. – Seabord SEB, $2,660 • Next day 2 shares of – NVR $703 125 – 2x125=$250. – GOOG -- $618 no splits. Started at $100 in 2004 2017 prices https://www.forbes.com/sites/investor/2011/07/25/bershire-seaboard-google-priceline/#78528b8d64ab Why Split? • How to deal with • Less Liquid, less volume stock split data • Options on stocks are usually traded with • Not short stocks when regard to 100 shares. company value has • Finely Tuned portfolio (harder with high not change: priced stocks). – Adjusted Close. this situation. This green line represents the actual price – Current Day: • Adjusted close = close • Back in history need to adjust it.

  4. Dividends • How to deal with • Dividends, stock split data – Annually – Quarterly • Not short stocks when • Example company value has – $100.00 not change: – $1.00 dividend – Adjusted Close. announced (1%) this situation. This green line represents the actual price – Stock value? – Current Day: Here we have: • Assume consensus • Adjusted close = close $1 + $100 share of stock vale is 1) What is the value of the • Back in history need to $100.00 (may not stock the day before be the price). adjust it. dividend payout? 2) What is the value on they day of payout? • Day before • Answer: and day off? – $101 day before – $100 day after.

  5. Adjusting for Dividends Survivor Bias • SP 500 • Similar to stock – Membership Change. • Simulate todays list in the past using splits. historical data • Red line is – Current list survived in the past. Adjusted close. • Survivor Bias- – Inflation of funds that remain when poor performers are not part of the equation. • Need survivor bias free data (costs money). – To more accurately measure strategies working on historical data. – Need to know historical lists of companies. https://www.elitetrader.com/et/threads/can-anyone-recommend-a-source-of-historical-data-without-survivor-bias.212720/

Download Presentation
Download Policy: The content available on the website is offered to you 'AS IS' for your personal information and use only. It cannot be commercialized, licensed, or distributed on other websites without prior consent from the author. To download a presentation, simply click this link. If you encounter any difficulties during the download process, it's possible that the publisher has removed the file from their server.

Recommend


More recommend