Data Generation and Evaluation Using Deep Learning Ye Ji An a , Ji - - PDF document

data generation and evaluation using deep learning
SMART_READER_LITE
LIVE PREVIEW

Data Generation and Evaluation Using Deep Learning Ye Ji An a , Ji - - PDF document

Transactions of the Korean Nuclear Society Virtual Spring Meeting July 9-10, 2020 Data Generation and Evaluation Using Deep Learning Ye Ji An a , Ji Hun Park a , So Hun Yun a , Man Gyun Na a a Department of Nuclear Engineering, Chosun


slide-1
SLIDE 1

Transactions of the Korean Nuclear Society Virtual Spring Meeting July 9-10, 2020

Data Generation and Evaluation Using Deep Learning

Ye Ji An a, Ji Hun Park a, So Hun Yun a, Man Gyun Na a

aDepartment of Nuclear Engineering, Chosun University, 309 Pilmun-daero, Dong-gu, Gwangju, Korea *Corresponding author: magyna@chosun.ac.kr

  • 1. Introduction

Promising artificial intelligence (AI) research applicable to real nuclear power plants (NPPs) requires a lot of real data. In NPPs, real data is limited due to

  • confidentiality. Simulation data was generated using the

generative adversarial network (GAN) [1] to analyze whether AI models are generating data well even under limited circumstances. The GAN is a methodology for generating images. The GAN, consisting of a generator and discriminator, aims to generate real images using features extracted from image data. Recently, as various studies using the GAN have been conducted it can be applied to time-series data, table data, etc. Therefore, the GAN was applied to generate time-series data, and a classification model using the deep neural network (DNN) [2] was applied for the quantitative evaluation

  • f data.

The GAN has a deep neural network structure composed of two networks. The GAN is known to have three limitations. First, the GAN is unstable during

  • training. Second, it is impossible to know what process

the result of the used generator came from. Third, there is no quantitative evaluation standard for the accuracy

  • f newly generated data [3]. In general, when

generating an image, the image quality is determined by humans and has a subjective disadvantage. As a result, various models based on the GAN have been studied to improve the performance of the GAN. In this paper, one of the GAN models, the deep convolutional GAN (DCGAN) [3] was used. For the quantitative evaluation of the GAN, the DNN classification model using the accident simulation data

  • btained from the modular accident analysis program

(MAAP) code [4] was used.

  • 2. DCGAN (Deep Convolutional Generative

Adversarial Network) In this paper, the DCGAN [3] was used as the data generation model. The DCGAN is almost similar to the existing GAN [1], but most of the fully-connected structures are used as convolution layers, which are the structures of the convolutional neural network. In addition, strided convolutions were used instead of the pooling layers, and batch-normalization was used for the generator and discriminator. DCGAN is a deep neural network structure composed of two networks; a generator and a

  • discriminator. The applied GAN model trains the

generator after training the discriminator to generate data that can fool the trained discriminator.

~ ( ) ~ ( )

min max ( , ) [log ( )] [log(1 ( ( ))]

data z

G D x P x z p z

V D G E D x E D G z    (1) where

( ) D x : Discriminator’s outputs ( ) G z : Generator’s outputs ~ ( )

data

x p x

: Data sampled from a probability distribution for real data

~ ( )

z

z p z : Data sampled from random noise using

the Gaussian distribution

z : Noise vector

  • Eq. (1) shows the objective function or loss function
  • f the DCGAN. In Eq. (1),

( ) D x outputs 1 if the data

is real and 0 if it is fake.

( ( )) D G z

  • utputs 1 if the data

( ) G z generated by the generator is determined to be

real and 0 if it is determined to be fake. To maximize Eq. (1) value from the discriminator’s perspective, the first term and the second term should be the maximum. So,

( ) D x should be 1 and ( ( )) D G z

should be 0. Through this process, the discriminator trains how to classify real data into fake and real data. From the generator’s perspective,

( ( )) D G z

should be 1 to minimize Eq. (1). This process is to train the generator to generate data that can trick the

  • discriminator. In this way, in the adversarial learning,

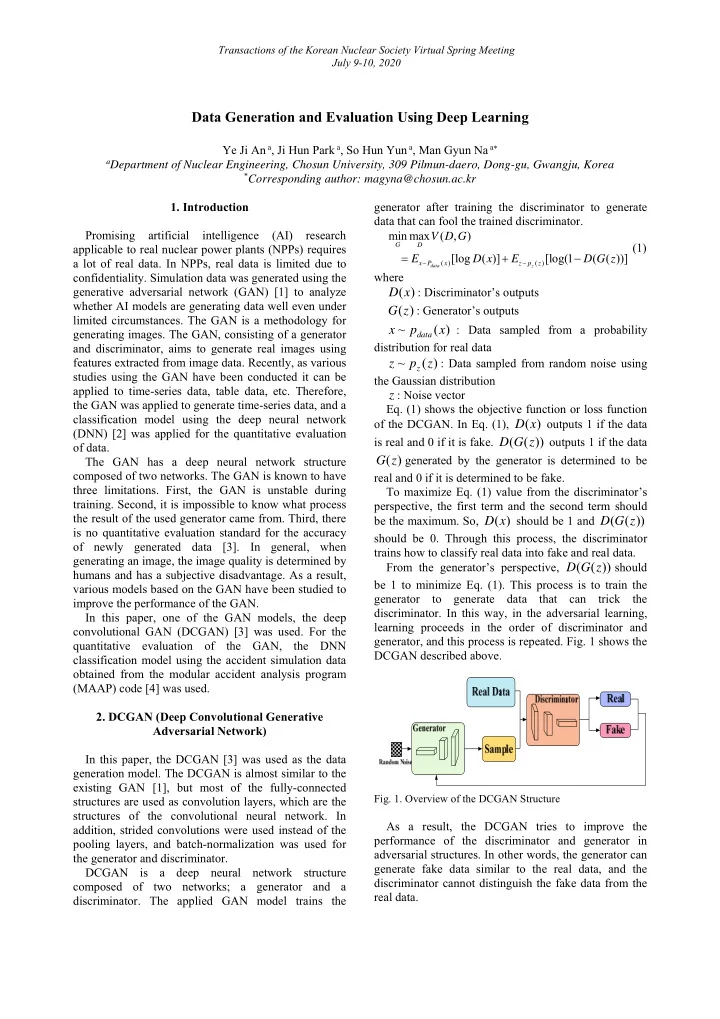
learning proceeds in the order of discriminator and generator, and this process is repeated. Fig. 1 shows the DCGAN described above.

  • Fig. 1. Overview of the DCGAN Structure

As a result, the DCGAN tries to improve the performance of the discriminator and generator in adversarial structures. In other words, the generator can generate fake data similar to the real data, and the discriminator cannot distinguish the fake data from the real data.

slide-2
SLIDE 2

Transactions of the Korean Nuclear Society Virtual Spring Meeting July 9-10, 2020

  • 3. DNN (Deep Neural Network)

In this paper, a classification model using the DNN is used to analyze the results of data generated using the

  • DCGAN. The DNN is a methodology based on an

artificial neural network algorithm that mimics the structure of the human brain. The DNN model consists

  • f multiple hidden layers between the input and output
  • layers. The DNN is composed of multiple layers, and
  • ne layer is composed of multiple nodes.

           

  • Fig. 2. Overview of the DNN Structure

As shown in Fig.2, the DNN model classifies and predicts specific data labels by learning specific patterns from various input data. The performance of the DNN model is determined by the activation function and the number of hidden layers and nodes. But, as the number of parameters increases, the model is complex and it takes a lot of time to train the model. Moreover, there is the disadvantage that overtraining the training data causes overfitting problems, such as an increased error in the test data.

  • 4. Data Applied to Data Evaluation

The data applied to the classification model for quantitative evaluation and verification was obtained through the simulation using the MAAP code [4]. To verify the data generated by the DCGAN model, 6 accident scenarios such as loss of coolant accidents (LOCA), steam generator tube rupture (SGTR), feedwater line break (FWLB), main steam line break (MSLB), MSLB+SGTR, station blackout (SBO), main feedwater pump (MFW) off, were applied to the classification model. The data was generated for the corresponding scenario using the DCGAN, and the results of the DCGAN were compared with the real

  • data. After that, the data generated using the DCGAN

model was applied to the trained DNN classification model and to verify that the performance can be classified into the corresponding scenario for

  • verification. Fig. 3 shows the total number of data used

in this study.

210 210 210 210 10 3 3

Hot-leg LOCA Cold-leg LOCA SGTR MSLB+SGTR MSLB SBO MFW Pump OFF

50 100 150 200 250

  • NO. of data

Accident scenarios Data

  • Fig. 3. Histogram of data
  • 5. Results of Study
  • Figs. 4 and 5 show the real and generated data of the

cold-leg LOCA scenarios. Fig. 4 shows the real data distribution of the cold-leg LOCA. Fig. 5 shows the distribution of data generated using the DCGAN model. When visually compared, the generated data can be notified to be similar to the distribution of the real data.

  • Fig. 4. Real data distribution of cold-leg LOCA
slide-3
SLIDE 3

Transactions of the Korean Nuclear Society Virtual Spring Meeting July 9-10, 2020

  • Fig. 5. Generated data distribution of cold-leg LOCA
  • Figs. 6-12 show the results of applying the data

generated for each scenario to the DNN classification model with the DCGAN. In the graph, the x-axis is time and the y-axis is the probability of diagnosis. In this paper, the verification standard for the DCGAN results were set as a classification model using the DNN since there is no quantitative evaluation standard of the GAN. As shown in Figs. 6-10, the data distribution generated by the DCGAN is generated according to the distribution of the real data and is well categorized. However, the classification results for scenarios with a little of data were relatively poor compared to scenarios with a lot of data (refer Fig. 3).

  • Fig. 6. Verification of hot-leg LOCA
  • Fig. 7. Verification of cold-leg LOCA
  • Fig. 8. Verification of SGTR
  • Fig. 9. Verification of MSLB
slide-4
SLIDE 4

Transactions of the Korean Nuclear Society Virtual Spring Meeting July 9-10, 2020

  • Fig. 10. Verification of MSLB+SGTR
  • Fig. 11. Verification of SBO
  • Fig. 12. Verification of MFW Pump OFF
  • 6. Conclusions

In this paper, the deep convolutional generative adversarial network (DCGAN), a model that complements the performance of the GAN, was applied to generate data based on time-series data. In addition, since there is no quantitative evaluation standard of the GAN, data generation results were analyzed using the deep neural network (DNN) classification model. The data generated using the DCGAN was well generated by comparing it with real data through visual or the DNN classification models. The GAN is a model that generates data and will contribute to generating appropriate data in situations that require a lot of data. Acknowledgment This work was supported by the National Research Foundation of Korea (NRF) grant, funded by the Korean Government (MSIT) (Grant No. 2018M2B2B1065651). REFERENCES

[1] I. Goodfellow, J. Pouget-Abadie, M. Mirza, B. Xu, D. Warde-Farley, S. Ozair, A. Courville, and Y. Bengio, Generative Adversarial Nets, In Advances in Neural Information Processing Systems (NIPS), pp. 2672–2680, 2014. [2] Y. LeCun, Y. Bengio, and G. Hinton, Deep Learning, Nature, Vol. 521, pp. 436-444, 2015. [3] Alec Radford, Luke Metz, and Soumith Chintala. Unsupervised representation learning with deep convolutional generative adversarial networks, CoRR, abs/1511.06434, 2015. [4] F. Rahn, et al., MAAP4 Applications Guidance Desktop Reference for Using MAAP4 Software, Revision 2, Electric Power Research Institute, 2010.