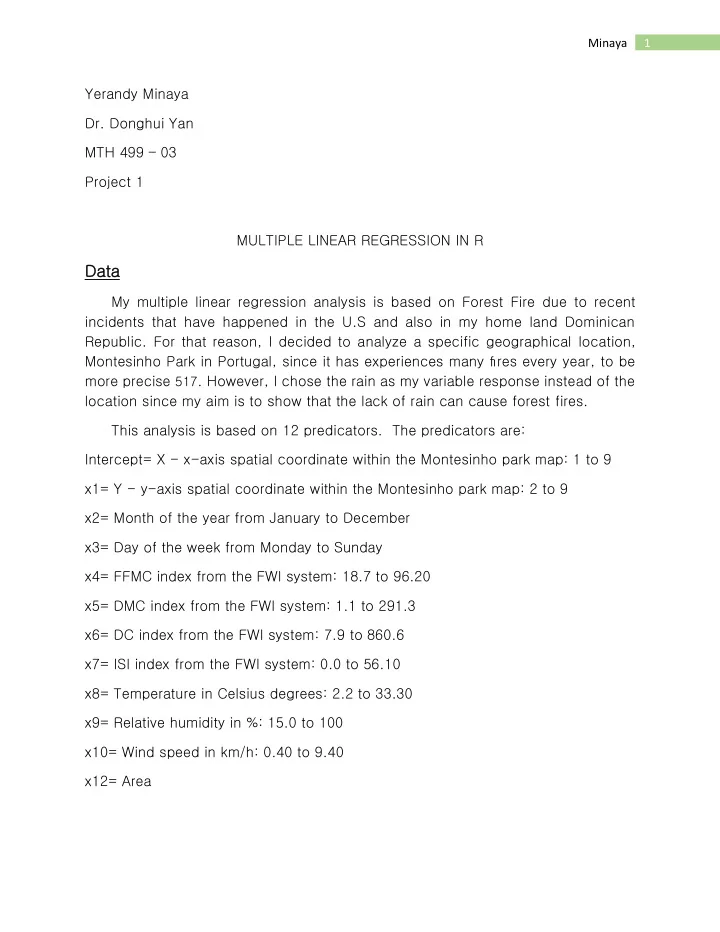

Minaya 1 Yerandy Minaya Dr. Donghui Yan MTH 499 – 03 Project 1 MULTIPLE LINEAR REGRESSION IN R Da Data ta My multiple linear regression analysis is based on Forest Fire due to recent incidents that have happened in the U.S and also in my home land Dominican Republic. For that reason, I decided to analyze a specific geographical location, Montesinho Park in Portugal, since it has experiences many fires every year , to be more precise 517 . However, I chose the rain as my variable response instead of the location since my aim is to show that the lack of rain can cause forest fires. This analysis is based on 12 predicators. The predicators are: Intercept= X - x-axis spatial coordinate within the Montesinho park map: 1 to 9 x1= Y - y-axis spatial coordinate within the Montesinho park map: 2 to 9 x2= Month of the year from January to December x3= Day of the week from Monday to Sunday x4= FFMC index from the FWI system: 18.7 to 96.20 x5= DMC index from the FWI system: 1.1 to 291.3 x6= DC index from the FWI system: 7.9 to 860.6 x7= ISI index from the FWI system: 0.0 to 56.10 x8= Temperature in Celsius degrees: 2.2 to 33.30 x9= Relative humidity in %: 15.0 to 100 x10= Wind speed in km/h: 0.40 to 9.40 x12= Area
Minaya 2 Mul ultip tiple Lin inear Regr gression ion Analys ysis is By definition the t-va value is a statistic that measures the ratio between the coeffi ficie ient and its stand ndard error. A sufficiently large ratio indicates that the coeffi ficie ient estima mate is both large and precise enough to be significantly different from zero. Conversely, a small ratio indicates that the coeff fficie ient nt estimate is too small or too imprecise to be certain that the term has an effect on the response. In this case we have that the location, the DMC, the ISI, and the rain does not have any effect. My hypothesis test is at 95% confident interval, meaning that my =0.05. By definition a coefficient is significant if the corresponding (p-va value) is less than =0.05 and, therefore, we can reject the Null hypothesis. In this analysis we have: Intercept=is very significant at Montesinho park map: 1 to 9 x2: is very significant at the month of the year x3: is significant at day of the week: "mon" to "sun" x6: is significant at DC index from the FWI system: 7.9 to 860.6 x7: is very significant at DMC index from the FWI system: 1.1 to 291.3 R
Minaya 3 x8: is very significant at temperature in Celsius degrees: 2.2 to 33.30R x9: Very significant at relative humidity in %: 15.0 to 100R x10:very significant at wind speed in km/h: 0.40 to 9.40 R R^2 ^2 in this data set is very good since is 1 F-statis istic in this data set is 6.305e+33 on 11 and 505 DF, and because P-value: < 2.2e-16, which is less than =0.05, we can reject H 0 . Kol olmog ogor orov ov-Smir irnov ov Test By computing the Kolmogorov-Smimov Test we can notice that in this case we get an extremely low p-value, meaning that we can reject the H 0 . This test coincide with the multiple linear regression. And that’s what we want.
Minaya 4 Nor ormal Q-Q Plot ot By looking at the Q-Q plot we conclude that is a Normal distribution since the values lie on a straight diagonal line. Te Testing ng of cons nstant va variance By the testing of constant variance we can notice that the P values is very small, meaning that the variable is not constant To show greater accuracy, I plotted the Leverage and Cook’s Distance.
Minaya 5 Leve verage ge Test t
Minaya 6 Cook’s distance In the Cook’s distance w e can observe two outliers, indicating a data entry error or other problem.
Minaya 7 The Spr pread-Leve vel Plot ot By plotting the spread level, I conclude this presentation since the plot does not subject any transformation.
Minaya 8 Works Cited Cortez, Paulo, and Aníbal Morais . "UCI Machine Learning Repository: Forest Fires Data Set." UCI Machine Learning Repository: Forest Fires Data Set . N.p., 2007. Web. 05 Apr. 2015.
Recommend
More recommend