
SLIDE 1
CSE-571 Probabilistic Robotics
Mapping
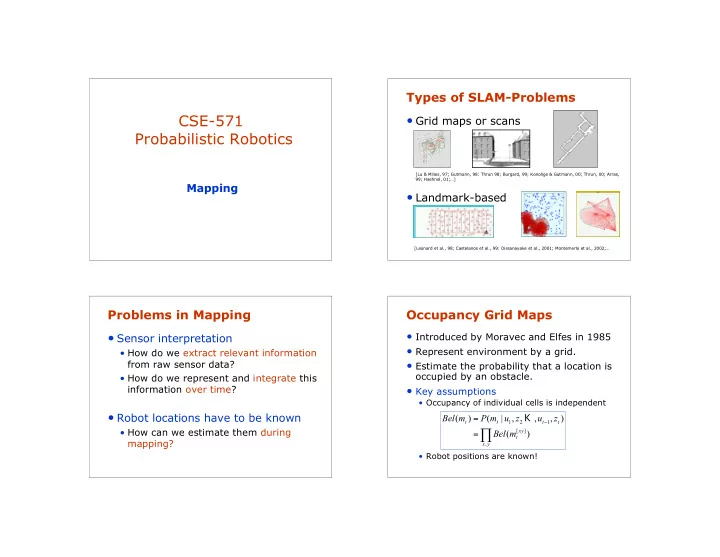
Types of SLAM-Problems
- Grid maps or scans
[Lu & Milios, 97; Gutmann, 98: Thrun 98; Burgard, 99; Konolige & Gutmann, 00; Thrun, 00; Arras, 99; Haehnel, 01;…]
- Landmark-based
[Leonard et al., 98; Castelanos et al., 99: Dissanayake et al., 2001; Montemerlo et al., 2002;…
Problems in Mapping
- Sensor interpretation
- How do we extract relevant information
from raw sensor data?
- How do we represent and integrate this
information over time?
- Robot locations have to be known
- How can we estimate them during
mapping?
Occupancy Grid Maps
- Introduced by Moravec and Elfes in 1985
- Represent environment by a grid.
- Estimate the probability that a location is
- ccupied by an obstacle.
- Key assumptions
- Occupancy of individual cells is independent
- Robot positions are known!
- =
=
- y
x xy t t t t t
m Bel z u z u m P m Bel
, ] [ 1 2 1