Computational Tools Data Simple Calculator Spreadsheet - - PowerPoint PPT Presentation

computational tools
SMART_READER_LITE
LIVE PREVIEW

Computational Tools Data Simple Calculator Spreadsheet - - PowerPoint PPT Presentation

Computational Tools Data Simple Calculator Spreadsheet Processing Complex Hybrid Scripting (toolbox, Language addon) Structured Unstructured 43 Logistics Software Stack MIP Solver Standard Library Data Report (Gurobi, etc.)


slide-1
SLIDE 1

Computational Tools

43

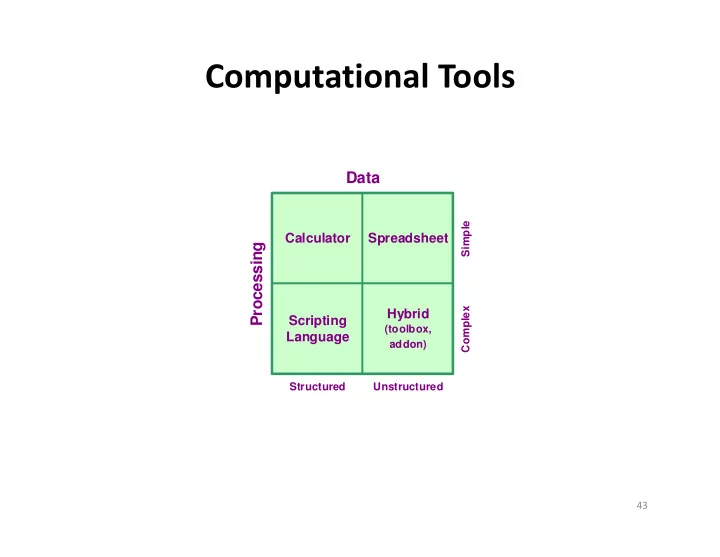
Calculator Spreadsheet Scripting Language Hybrid

(toolbox, addon)

Data Processing

Structured Unstructured Complex Simple

slide-2
SLIDE 2

Logistics Software Stack

44

  • New Julia (1.0) scripting language

– (almost?) as fast as C and Java (but not FORTRAN) – does not require compiled standard library for speed – uses multiple dispatch to make type-specific versions of functions

MIP Solver

(Gurobi,Cplex,etc.)

Standard Library

(in compiled C,Java)

User Library

(in script language)

MIP Solver (Gurobi, etc.) Standard Library (C,Java) Data

(csv,Excel,etc.)

Report

(GUI,web,etc.) Commercial Software (Lamasoft,etc.)

Scripting

(Python,Matlab,etc.)

slide-3
SLIDE 3

PharmaCo Case Study

45

slide-4
SLIDE 4

Logistics Engineering Design Constants

1. Circuity Factor: 1.2 ( g )

– 1.2 × GC distance ≈ actual road distance

2. Local vs. Intercity Transport:

– Local: < 50 mi  use actual road distances – Intercity: > 50 mi  can estimate road distances

  • 50-250 mi  return possible (11 HOS)
  • > 250 mi  always one-way transport
  • > 500-750 mi  intermodal rail possible

3. Inventory Carrying Cost ( h ) = funds + storage + obsolescence

– 16% average (no product information, per U.S. Total Logistics Costs)

  • (16% ≈ 5% funds + 6% storage + 5% obsolescence)

– 5-10% low-value product (construction) – 25-30% general durable manufactured goods – 50% computer equipment – >> 100% perishable goods (produce)

46

slide-5
SLIDE 5

Logistics Engineering Design Constants

4. 5. TL Weight Capacity: 25 tons ( Kwt )

– (40 ton max per regulation) – (15 ton tare for tractor-trailer) = 25 ton max payload – Weight capacity = 100% of physical capacity

6. TL Cube Capacity: 2,750 ft3 ( Kcu )

– Trailer physical capacity = 3,332 ft3 – Effective capacity = 3,332 × 0.80 ≈ 2,750 ft3 – Cube capacity = 80% of physical capacity

≈ ≫

3 3

$2,620 Shanghai-LA/LB shipping cost 2,400 Value 1: Transport Cost ft 40’ ISO container capa $1 ft city

47

Interior Height: (8'6" - 9'2" = 102" - 110") Max Height: 13'6" = 162"

slide-6
SLIDE 6

Logistics Engineering Design Constants

7. TL Revenue per Loaded Truck-Mile: $2/mi in 2004 ( r )

– TL revenue for the carrier is your TL cost as a shipper = − ≈ − 15%, average deadhead travel $1.60, cost per mile in 2004 $1.60 $1.88, cost per loaded-mile 1 0.15 6.35%, average operating margin for trucking $1.88 $2.00, revenue per loaded-mile 1 0.0635

48

slide-7
SLIDE 7

One-Time vs Periodic Shipments

  • One-Time Shipments (operational decision): know

shipment size q

– Know when and how much to ship, need to determine if TL and/or LTL to be used – Must contact carrier or have agreement to know charge

  • Can/should estimate charge before contacting carrier
  • Periodic Shipments (tactical decision): know demand

rate f, must determine size q

– Need to determine how often and how much to ship – Analytical transport charge formula allow “optimal” size (and shipment frequency) to be estimated

  • U.S. Bureau of Labor Statistic's Producer Price Index (PPI) for TL

and LTL used to estimate transport charges

49

slide-8
SLIDE 8

Truck Shipment Example

  • Product shipped in cartons from

Raleigh, NC (27606) to Gainesville, FL (32606)

  • Each identical unit weighs 40 lb

and occupies 9 ft3 (its cube)

– Don’t know linear dimensions of each unit for TL and LTL

  • Units can be stacked on top of

each other in a trailer

  • Additional info/data is

presented only when it is needed to determine answer

50

slide-9
SLIDE 9

Truck Shipment Example: One-Time

1. Assuming that the product is to be shipped P2P TL, what is the maximum payload for each trailer used for the shipment?

{ }

max 3 3 3 max max max max max

25 ton 2750 ft 40 lb/unit 4.4444 lb/ft 9 ft /unit 2000 2000 min , min , 2000 4.4444(2750) min 25, 6.1111 ton 2000

wt wt cu cu cu cu cu cu wt cu wt

q K K s q sK K q s sK q q q K = = = = = =  =         = =       = =    

51

slide-10
SLIDE 10

Truck Shipment Example: One-Time

2. On Jan 10, 2018, 320 units of the product were shipped. How many truckloads were required for this shipment? 3. Before contacting the carrier (and using Jan 2018 PPI ), what is the estimated TL transport charge for this shipment?

max

40 6.4 320 6.4 ton, 2 truckloads 2000 6.1111 q q q     = = = =        

Jan 2018 2004 2004 max

532 mi $2.00 / mi 102.7 131.0 $2.00 / mi $2.5511/ mi 102.7 6.4 (2.5511)(532) $2,714.39 6.1111

TL TL TL TL TL TL

d PPI PPI r r PPI q c r d q = = × = × = × =     = = =        

52

slide-11
SLIDE 11

Truck Shipment Example: One-Time

53

slide-12
SLIDE 12

Truck Shipment Example: One-Time

4. Using the Jan 2018 PPI LTL rate estimate, what was the transport charge to ship the fractional portion of the shipment LTL (i.e., the last partially full truckload portion)?

( )

( )

frac max 2 1 15 2 7 29 frac 2 1 15 2 7 29 frac

6.4 6.1111 0.2889 ton 14 8 7 2 14 2 4.44 14 8 177.4 $3.8014 / ton-mi 7 4.44 2(4.44) 14 0.2889 532 2 3.8014(0.28

LTL LTL LTL LTL

q q q s r PPI s s q d c r q d = − = − =   +     =     + + −           +     = =     + + −         = = 89)(532) $584.23 =

54

slide-13
SLIDE 13

Truck Shipment Example: One-Time

5. What is the change in total charge associated with the combining TL and LTL as compared to just using TL?

( )

1 frac max max

$772.96

TL TL LTL TL TL LTL

c c c c q q r d r d r q d q q

∆ = − +       = − +             =

55

slide-14
SLIDE 14

Truck Shipment Example: One-Time

6. What would the fractional portion have to be so that the TL and LTL charges are equal?

( )

( )

max 2 1 15 2 7 29

( ) 14 8 ( ) 7 2 14 2 ( ) ( ) arg min ( ) ( ) 0.7960 ton

TL TL LTL LTL LTL LTL I TL LTL q

q c q r d q s r q PPI s s q d c q r q qd q c q c q   =       +     =     + + −         = = − =

56

0.2 0.4 0.6 0.8 1 1.2 1.4 1.6

Shipment Size (ton)

200 400 600 800 1000 1200 1400

Indifference Point between TL and LTL

slide-15
SLIDE 15

Truck Shipment Example: One-Time

7. What are the TL and LTL minimum charges?

  • Why do these charges not depend on the size of the

shipment?

  • Why does only the LTL minimum charge depend of the

distance of the shipment?

28 19 28 19

45 $57.40 2 45 104.2 1625 177.4 532 45 $87.51 104.2 1625

TL TL LTL LTL

r MC PPI d MC   = =           = +              = + =       

57

0.01 0.02 0.03 0.04 0.05 0.06

Shipment Size (ton)

20 40 60 80 100 120 140 160

Indifference Point between MC and LTL

cLTL c0

slide-16
SLIDE 16

Truck Shipment Example: One-Time

  • Independent Transport Charge ($):

{ } { }

{ }

0( )

min max ( ), ,max ( ),

TL TL LTL LTL

c q c q MC c q MC =

58

1 2 3 4 5 6 7

Shipment Size (ton)

500 1000 1500 2000 2500

Independent shipment charge: Class 200 from 27606 to 32606

slide-17
SLIDE 17

Truck Shipment Example: One-Time

  • PX: Package Express

– (Undiscounted) charge cPX based rate tables, R, for each service (2- day ground, overnight, etc.) – Rate determined by on chargeable weight, wtchrg, and zone – All PX carriers (FedEX, UPS, USPS, DHL) use dimensional weight, wtdim – wtdim > 150 lb is prorated per-lb rate – Actual weight 1–70 lb (UPS, FedEx home), 1–150 lb (FedEx commercial) – Carrier sets a shipping factor, which is min cubic volume per pound – Zone usually determined by O-D distance of shipment – Supplemental charges for home delivery, excess declared value, etc.

64

( )

{ }

chrg chrg act dim act 3 dim 3 3 3

, max , (lb) actual weight (1 to 150 lb) (in ) (lb) (in / lb) , , length, width, depth (in) , actual cube shipping factor (in / lb) 12 , invers

PX

c R wt zone wt wt wt wt l w d wt sf l w d l w l w d sf s =   =   = × × = = ≥ × × ≥ = =

3 3

e of density 139 FedEx (2019) 12.43 lb/ft (Class 85) 194 USPS 8.9 lb/ft s s =  = =  =

slide-18
SLIDE 18

Truck Shipment Example: One-Time

  • (Undisc.) charge to ship a

single carton via FedEx?

65

{ } { }

( )

( )

3 act 3 3 dim chrg act dim chrg

40 lb, 9 ft 532 mi 4 carton actual cube 9 12 15,552 in 32 27 18 15,552 111.9 lb 139 max , max 40,111.9 112 lb , 112,4 $64.2

PX

wt cu d zone l w d l w d l w d wt sf wt wt wt c R wt zone R = = =  =  × × =  × × = × = = × × × × = = =   =     = =   = = = 7

FedEx Standard List Rates (eff. Jan. 7, 2019)

Note: No Zone 1 (usually < 50 mi local)