
SLIDE 1
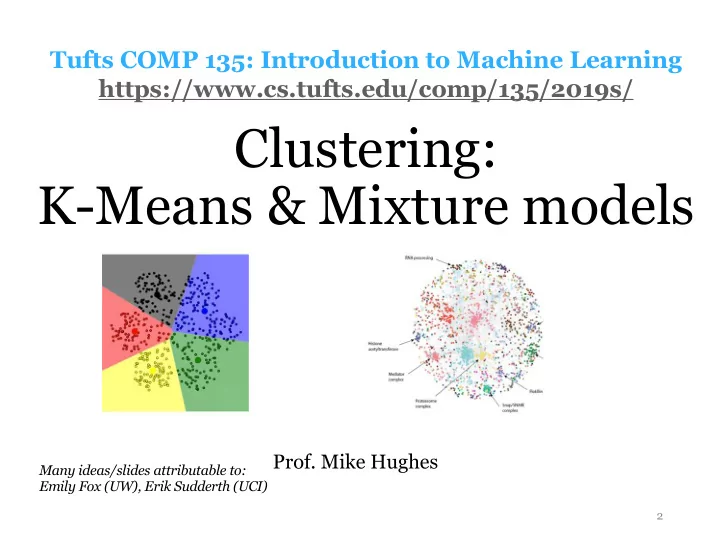
Clustering: K-Means & Mixture models
2
Tufts COMP 135: Introduction to Machine Learning https://www.cs.tufts.edu/comp/135/2019s/
Many ideas/slides attributable to: Emily Fox (UW), Erik Sudderth (UCI)
- Prof. Mike Hughes