
SLIDE 1
Childhood Retrospective Circumstances Study
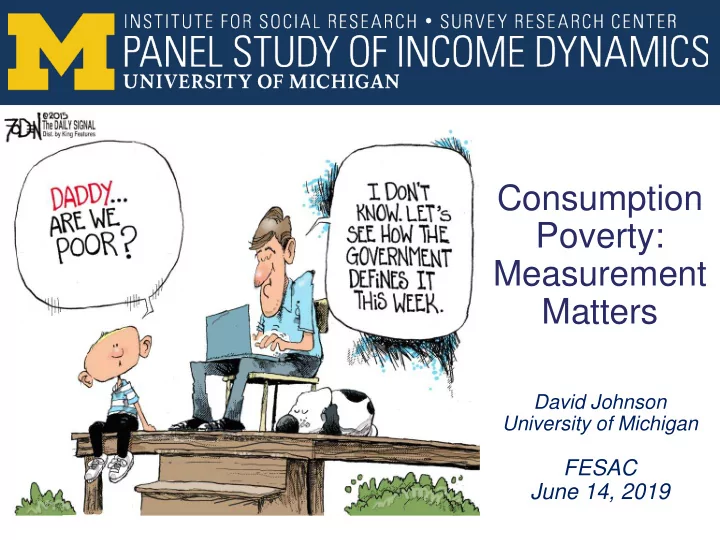
Consumption Poverty: Measurement Matters
David Johnson University of Michigan
FESAC June 14, 2019
Childhood Consumption Retrospective Poverty: Measurement - - PowerPoint PPT Presentation
Childhood Consumption Retrospective Poverty: Measurement Circumstances Matters Study David Johnson University of Michigan FESAC June 14, 2019 What is Poverty ? What is Poverty? National Academy of Science Panel on NAS Report: What is
David Johnson University of Michigan
FESAC June 14, 2019
“We define poverty as econom ic deprivation. A way of expressing this concept is that it pertains to people’s lack of economic resources (e.g., money or near money income) for consumption
housing, clothing, transportation). Thus, a poverty standard is based on a level of family resources (or, alternatively, of families’ actual consumption) deem ed necessary to obtain a m inim ally adequate standard of living, defined appropriately for the United States today.”
standard of living
(net of taxes), and can demonstrate impact
costs
care and differences between owners and renters
See https://www.census.gov/library/publications/2018/demo/p60-265.html
consumption and income resource definitions treat people who are income-rich but consumption-poor and people who are in the reverse situation depends on
reflect the actual level of material well-being or consumption in the society (in terms of the number of people above the threshold), regardless of how that well- being is attained. Another view is that the poverty measure should reflect people's ability to obtain a level
use of their own income and related resources.
definition of family resources for the poverty measure on income or consumption, we believe that there are merits to the conceptual arguments on both sides of the debate. On balance, many members of the panel find more compelling the arguments in favor of a consumption definition that attempts to assess actual levels of material well-being. However, in the United States today, adequate data with which to implement a consumption-based resource definition for use in the
Example 1: Traditional model
5000 10000 15000 20000 25000 30000 35000 40000 45000 50000
20 25 30 35 40 45 50 55 60 65 70 75 80 85
Time/Age
Annual income Consumption
Example 1: Traditional model
5000 10000 15000 20000 25000 30000 35000 40000 45000 50000
20 25 30 35 40 45 50 55 60 65 70 75 80 85
Time/Age
Annual income Consumption
Example 1: Traditional model
5000 10000 15000 20000 25000 30000 35000 40000 45000 50000
20 25 30 35 40 45 50 55 60 65 70 75 80 85
Time/Age
Annual income Consumption
Example 2: Over-consuming by excessive debt
5000 10000 15000 20000 25000 30000 35000 40000 45000 50000 20 25 30 35 40 45 50 55 60 65 70 75 80 85
Time/Age
Consumption Annual income
Example 3: Under-reported Income
5000 10000 15000 20000 25000 30000 35000 40000 45000 50000 20 25 30 35 40 45 50 55 60 65 70 75 80 85
Time/Age
Reported income Consumption Annual income
Consumption is related to income (.6) 80% lie between Consumption-to- income ratios (APC) of .5 and 2
(currently MSA level)
spending data
– Housing, Health, Education – Measuring service flows for housing and durables
clothing)
programs
Under-reporting in CE survey compared to CPS
50 55 60 65 70 75 80 85 90 95 100 CPS/PI - Katz (Fixler/Johnson) CE/PCE - Bee, Meyer, Sullivan CE/PCE - BLS CPS/PI - Census
CE/PCE see https://www.bls.gov/cex/cepceconcordance.htm CPS/PI see https://www.census.gov/content/dam/Census/library/working-papers/2015/demo/SEHSD-WP2015-01.pdf
Ratio: Survey total to NIPA
Quarterly*4 Sum of 4 Quarters
*
(Pov=1 in 1980)
NOTE: All use thresholds adjusted by CPI-U-RS
Not Consumption poor Consumption poor Total Not SPM poor 73.8% 14.8% 88.6% SPM poor 6.4% 5.0% 11.4% Total 80.2% 19.8% 100%
– need all three – I, C & W
thresholds
– don’t only update with inflation. – Updates to Statistical Policy Directive 14
– Housing, Health, Education
– (CID and CED)
For the years 1959-1968 the statistics on poverty contained in the Census Bureau's Current Population Reports, Series P-60,
For the years 1969 and thereafter, the statistics contained in subsequent applicable reports in this series shall be used…The Bureau of the Census series continues the Social Security Administration definition for the base year, 1963… …Annual adjustments in Census series are based on changes in the average annual total Consumer Price Index (CPI) instead of changes in the cost of the U.S. Department of Agriculture's Economy Food Plan… ...Other measures of poverty may be developed for particular research purposes, and published, so long as they are clearly distinguished from the standard data series….
changes: Supplemental Poverty Measure (+$2,000,000)
National Academies of Sciences, Engineering, and Medicine to evaluate and improve the supplemental poverty measure.