SLIDE 1
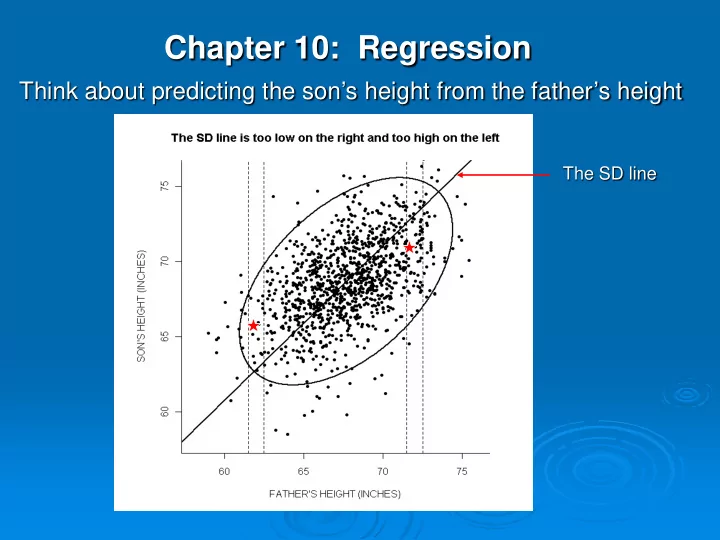
Chapter 10: Regression
The SD line
Think about predicting the son’s height from the father’s height
SLIDE 2
the SD line the regression line
SLIDE 3 The regression line is used to predict the y variable when we know the x variable. The regression line:
- goes through the point of averages (aveX, aveY)
- with
slope = r (SDY) SDX
SLIDE 4 To draw the regression line:
- go to the point of averages and put a dot
- move to the right SDX and up r (SDY), put another
dot (if r is negative, move down)
SLIDE 5
Midterm: ave = 75 SD = 10 r = 0.7 Final: ave = 70 SD = 12 Draw the regression line
SLIDE 6
To predict or estimate the value of y when you know the value of x:
1.
Find out how many SDs it is above or below the average in the x variable.
2.
Multiply the answer to step 1 by r.
3.
The answer to step 2 tells you how many SDs it is above or below the average in the y variable.
SLIDE 7 Example 1. Hanes, men 18-24: average height =70”, SD = 3” average weight = 162lb, SD = 30lb r = 0.47 Approximately what is the average weight of men who are
a)
76” tall?
b)
64” tall?
c)
69” tall?
d)
73” tall?
SLIDE 8
Example 2: Midterm: ave = 75 SD = 10 r = 0.7 Final: ave = 70 SD = 12 Estimate the final exam score for someone who got 87 on the midterm
SLIDE 9
Example 3: For the men aged 18-24 in the HANES sample, the relationship between height and systolic blood pressure can be summarized as follows: Average height ≈ 70”, SD ≈ 3” Average b.p. ≈ 124mm, SD ≈ 14mm r = -0.2 Estimate the average blood pressure of men who were 6 feet tall.
SLIDE 10
SLIDE 11
Another example: heights and weights
SD line regression line
SLIDE 12
SLIDE 13
CAUTION!
SLIDE 14 Example 4: Midterm: ave = 75 SD = 10 r = 0.7 Final: ave = 70 SD = 12
1.
Estimate the final exam score for someone who got 87 on the midterm.
2.
Estimate the midterm score for someone who got 80 on the final.
SLIDE 15
There are two regression lines!
Regression line for predicting FINAL Regression line for predicting MIDTERM SD line
SLIDE 16 MIDTERM MIDTERM
FINAL
FINAL FINAL
SLIDE 17
The Regression Effect
In test-retest situations, people with low scores tend to improve and people with high scores tend to do worse.
WHY? Chance Error!
SLIDE 18
The Regression Effect
Observed value = true value + chance error
Example: IQ test scores, average = 100, SD = 15. If someone scores 140 on their first test, they probably got a _________ chance error. If someone scores 80 on their first test, they probably got a _________ chance error.
Positive or negative
SLIDE 19 The Regression FALLACY
Attributing the regression effect to something other than chance error.
Example: A group of people get their blood pressure
- measured. Those that have high blood pressure return and
have their blood pressure measured again. We expect their second measurements to have a smaller average than their first measurements, due to the regression effect. Attributing this apparent drop to a change in behavior is the regression fallacy.