SLIDE 1 ECO 352 – Spring 2010
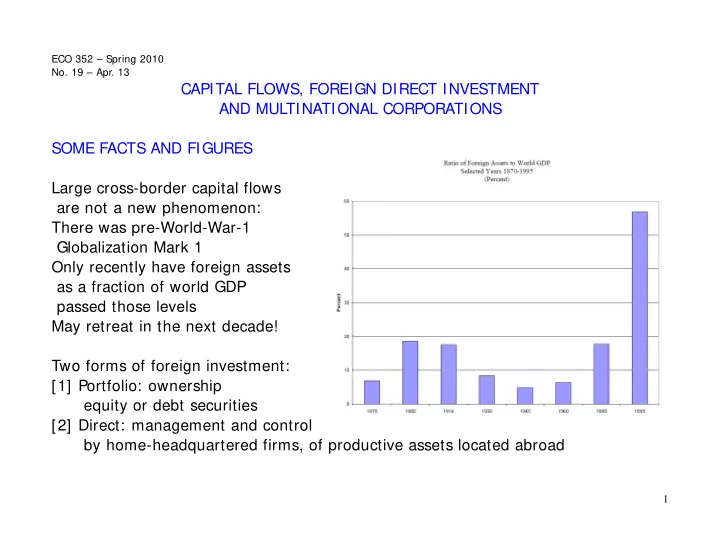
CAPITAL FLOWS, FOREIGN DIRECT INVESTMENT AND MULTINATIONAL CORPORATIONS SOME FACTS AND FIGURES Large cross-border capital flows are not a new phenomenon: There was pre-World-War-1 Globalization Mark 1 Only recently have foreign assets as a fraction of world GDP passed those levels May retreat in the next decade! Two forms of foreign investment: [1] Portfolio: ownership equity or debt securities [2] Direct: management and control by home-headquartered firms, of productive assets located abroad
1
SLIDE 2
The top-10 of portfolio investment: stock data for 2007 from IMF Coordinated Portfolio Investment Survey (CPIS) Note Large two-way holdings. Explanation: diversification
2
Country Assets $trillions Country Liabilities $trillions US 7.192 US 8.003 UK 3.432 UK 3.629 France 3.012 Germany 3.184 Luxembourg 2.883 France 2.389 Germany 2.637 Luxembourg 2.166 Japan 2.524 Cayman Islands 1.746 Ireland 1.970 Netherlands 1.716 Netherlands 1.467 Italy 1.510 Italy 1.242 Japan 1.422 Switzerland 1.058 Spain 1.368 Others 12.581 Others 12.233 Total 39.998 Total 39.369
SLIDE 3
The top-15 of foreign direct investment (FDI): stock data for 2007 from UNCTAD database WIR 2008 Note: [1] Large two-way holdings. [2] Not just rich country FDI into LDCs. [3] Substantial FDI by developing countries: around 15% of total and growing.
3
Region/economy Inward $bil Region/economy Outward $bil United States 2,093 United States 2,791 United Kingdom 1,348 United Kingdom 1,705 Hong Kong 1,184 France 1,399 France 1,026 Germany 1,236 Belgium 748 Hong Kong 1,027 Netherlands 673 Netherlands 851 Germany 630 Spain 637 Spain 537 Belgium 613 Canada 521 Switzerland 604 Italy 365 Japan 543 Brazil 328 Canada 521 China 327 Italy 520 Russian Federation 324 Sweden 309 Australia 313 Australia 278 Switzerland 279 Russian Federation 255 Developed economies 10,459 Developed economies 13,042 Developing economies 4,247 Developing economies 2,289 World 15,211 World 15,602
SLIDE 4
Intra-firm Trade: Trade between parent firm and subsidiary located in different countries Contrast with “arms-length” trade between independent firms
Imports into the United States by Trade Categories: As percent of total imports 1992 1997 Intermediate v. Final Goods Percent intermediate inputs 37% 38% Percent final goods 63% 62% Intra-Firm v. Arms’ Length Percent Intra-Firm 43% 52% a) US MNEs 17% 30% b) Foreign MNEs 26% 22% Percent Arms’ Length 57% 48% Total Imports $ Billions 505 748
Source: A. Bardhan and D. Jaffee, UC Berkeley manscript, 2004, http://faculty.haas.berkeley.edu/JAFFEE/Papers/ForeignDirectJaffeefBardhan.pdf
Thus approximately $150 billion of US imports were intra-firm intermediates This is expected to grow if vertical supply chains continue to get more complex
4
SLIDE 5 THEORY : INTERNATIONAL BORROWING & LENDING (as in No. 10, Mar. 4, p. 11) Suppose two periods: 1 = present, 2 = future. (Can generalize to any number.) Interpret the goods as X = present consumption C1 , Y = future consumption C2 PPF shows the ability to get more C2 by transferring labor, capital etc. away from production of goods for immediate consumption (C1) and into production of investment goods that enhance future consumption. Slope of PPF = = 1 + marg. product of investment = 1 + real rate of interest (r) Trade: consume less in the present than output;
- export. Send excess either consumption goods (consumption loan)
- r capital goods (that have higher MPK there) to the other country,
in exchange for promise to get (1+ r) times that amount of future cons. goods Run a trade surplus now, planning to run a trade deficit in the future Other country does the opposite; both gain from this trade
5
C C slope = 1 + r A TP TC
1 2
SLIDE 6
Show gains from trade by analogy with immigration: Capital flows from Foreign to Home Return to capital goes to owners in country of origin (Foreign) Measure of each country's welfare is GNP , not GDP Home: GDP increase 4+ 5+ 6+ 7 Foreign capital gets 5+ 6+ 7 GNP increase 4 Home capital loses 2 Other factors' surplus increase 2+ 4 Foreign: GDP decrease 6+ 7. Capital working in Home earns 5+ 6+ 7. GNP increase 5 Earnings of Foreign-owned capital increase by 5+ 6+ 9 Other factors' surplus decrease by 6+ 9 Political economy: Think who will support and who will oppose this capital flow.
6
K K K r r r VMPK 1 2 3
2 2 1 1
r K 4 5 6 7 8 9 VMPK * * r
1
r * *
2
10 * O O *
SLIDE 7
DEFICIENCIES OF THIS THEORY IN EXPLAINING FDI Definition of FDI: a company from “source” country making a physical investment in a production facility in “host” country. The definition can be extended to include investments made to acquire lasting interest in enterprises operating outside of the economy of the investor. The FDI relationship consists of a parent enterprise and a foreign affiliate which together form a multinational corporation (MNC).
Ownership of 10% or more is considered control. For many other practical issues of measurement, see http://www.oecd.org/dataoecd/10/16/2090148.pdf
Features of FDI: [1] Headquarters in "source" country, subsidiary/affiliate in "host" country [2] Longer term involvement than with portfolio investment [3] Horizontal - produce same goods in multiple locations in different countries [4] Vertical - intra-firm trade in intermediates between parent and subsidiary Why FDI at all? Must argue it is better than relevant alternatives: some or all of [1] Hold equity or debt of foreign firms without exercising managerial control [2] Produce everything in source country and export to host country [3] Outsource /license production to an independent firm in host country
7
SLIDE 8
Two key hypotheses to explain FDI: Location and Internalization LOCATION Case for producing in one location and exporting to other markets: (1) comparative advantage, (2) economies of scale Case for producing in separate plants for each market: (1) transport costs, (3) trade barriers (tariff-jumping FDI) (3) adaptation and flexibility to match local tastes, exploiting local knowledge But can these advantages be achieved by licensing or franchising to local firm? INTERNALIZATION Specific assets can be non-contractible: (1) managerial know-how cannot be credibly supplied in arm's length market, (2) secrets of materials or production processes (technology) may leak Non-contractible return to these can be bundled into return to capital Vertical supply chains may be better kept within the firm: (1) foreign suppliers may exercise monopoly power, (2) greater supply certainty, (3) reduction of price uncertainty
8
SLIDE 9
IMPLICATIONS OF THESE HYPOTHESES [1] Trade and capital flows will be complements In the factor endowment model they would be substitutes [2] Managerial and technological non-contractible know-how can be firm-specific, and each country may have some such firms in various sectors So should expect two-way flows of FDI, even within the same industry (What special know-how do the expanding LDC multinationals have? One guess – they have experience in operating under varied and difficult legal and political conditions; e.g. Mittal in Indonesia, Trinidad, Mexico.) [3] Vertical integration and therefore intra-firm trade is an essential part of the story THEORETICAL AND EMPIRICAL WORK BASED ON THESE HYPOTHESES Usual specification of the model: A firm in “the US” (an advanced economy) uses two inputs, one produced in its headquarters, the other in an LDC. Quality of the inputs is not contractible. This affects relative merits of vertical integration and outsourcing. Various hypotheses are generated, tested.
9
SLIDE 10 Vertical integration creates better incentive for the US firm to supply
- ptimal quality of its specialized input (technical and managerial know-how)
Outsourcing creates better incentive for the LDC firm to supply
- ptimal quality of its specialized input (upstream product in supply chain)
The choice depends on the relative importance of these two inputs for the final good Therefore [1] The share of intra-firm imports of a US multinational should be increasing in the share of the non-contractible inputs it provides Firms are heterogenous, and some have higher productivity because they have better technical and managerial know-how. Therefore [2] Across firms within an industry, the share of intra-firm imports of a US multinational should be increasing in its productivity If the LDC protects property rights well, the LDC firm's incentives can be contracted
- for. It becomes more important to incentivize the headquarters firm. Therefore
[3] The share of intra-firm imports of a US multinational firm should increase as property rights in the LDC are better enforced. Econometric work finds support for all three. (Optional: Nunn and Trefler 2007, at http://www.economics.harvard.edu/faculty/nunn/files/boundaries.pdf )
10
SLIDE 11 But this fits poorly with the growing picture of LDC-based multinationals. Future research in this area will need new examples: [1] Baosteel buys inputs from Rio Tinto, BHP Billiton, [2] Mittal buys Arcelor, [3] CNOOC is not allowed to buy Unocal, [4] Tata Motors buys Jaguar, Land Rover, [5] Lenovo buys IBM’s PC division And associated new explanations, hypotheses, e.g. Boston Consulting Group's taxonomy of emerging multinationals’ strategies: (see article “The Challengers,” in The Economist, January 10, 2008) [1] Develop local brand and then take it global: Chinese consumer durables; [2] Build on local engineering excellence: Embraer; [3] Narrow product niche: Johnson Electric (tiny motors); [4] Combine natural resources at home with global marketing, distribution skills: Brazilian agribusiness; [5] Take new business model global: Cemex. Some of these are similar to the picture of advanced-country MNCs turned around,
- thers may need view of special know-how that is specific to operating
in an LDC context.
11
SLIDE 12 SOME POLICY ISSUES WITH REGARD TO FOREIGN INVESTMENT AND MNCs [1] Workers in advanced countries oppose exports of capital, outsourcing etc. [2] Countries fear volatility of portfolio investment; LDC gov'ts prefer FDI but opposition, local NGOs often fear foreign domination [3] They also fear monetary and exchange rate consequences of large capital flows: inflows cause exchange rate appreciation and can harm current a/c trade
- utflows cause exchange rate collapse, reduction in real incomes etc.
Gov'ts want controls; but controls can create other problems, e.g. corruption [4] LDCs want advanced-country MNCs to transfer technology MNCs fear expropriation by LDC governments Need to construct contracts to mitigate fears, align incentives [5] Transfer pricing of intra-firm trade makes corporate profit taxation problematic [6] Prisoners' Dilemmas among LDC governments to attract FDI (Similar problems exist among US states, cities)
12