Based on 2007 ESRD Medicare data Total Medicare costs rose - - PDF document

based on 2007 esrd medicare data
SMART_READER_LITE
LIVE PREVIEW

Based on 2007 ESRD Medicare data Total Medicare costs rose - - PDF document

ASDIN 7th Annual Scientific Meeting Based on 2007 ESRD Medicare data Total Medicare costs rose Percutaneous Salvage of Thrombosed 7.0% in 2007, to $410 $410 BILLION BILLION BILLION . BILLION . . Costs for ESRD . Costs for ESRD Immature


slide-1
SLIDE 1

ASDIN 7th Annual Scientific Meeting 1

Percutaneous Salvage of Thrombosed I A F l

Gregg A. Miller MD Gregg A. Miller MD Assistant Clinical Professor, Columbia P & S Assistant Clinical Professor, Columbia P & S Chief Medical Officer, American Access Care Chief Medical Officer, American Access Care

Immature Arteriovenous Fistulas Based on 2007 ESRD Medicare data

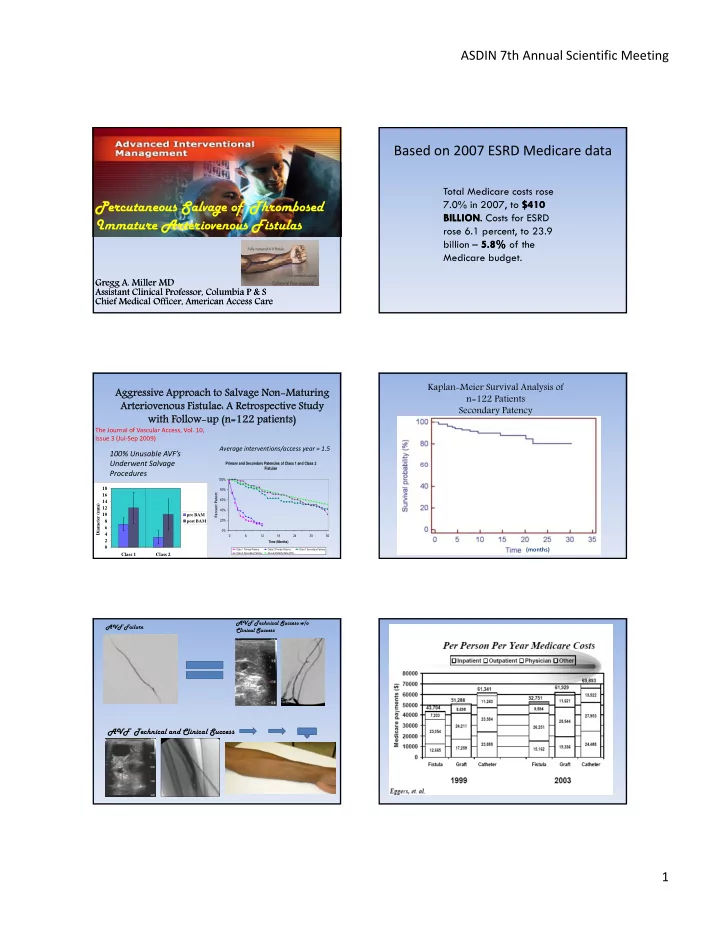
Total Medicare costs rose 7.0% in 2007, to $410 $410 BILLION BILLION. . Costs for ESRD BILLION BILLION. . Costs for ESRD rose 6.1 percent, to 23.9 billion – 5.8% 5.8% of the Medicare budget. Aggres Aggressiv sive Approach Approach to to Salvage Salvage Non-Maturing Non-Maturing Arteriovenous Arteriovenous Fistulae: A istulae: A Retrospect Retrospective Study ive Study with Follow-up with Follow-up (n=122 patients) (n=122 patients)

The Journal of Vascular Access, Vol. 10, Issue 3 (Jul‐Sep 2009)

Primary and Secondary Patencies of Class 1 and Class 2

100% Unusable AVF’s Underwent Salvage

Average interventions/access year = 1.5

2 4 6 8 10 12 14 16 18 Class 1 Class 2 Diameter (mm) pre BAM post BAM

Fistulae 0% 20% 40% 60% 80% 100% 6 12 18 24 30 36 Time (Months) Percent Patent

Class 1 Primary Patency Class 2 Primary Patency Class 1 Secondary Patency Class 2 Secondary Patency Annual Mortality Rate (20%)

Underwent Salvage Procedures

Kaplan-Meier Survival Analysis of n=122 Patients Secondary Patency

(months) AVF Failure AVF Technical Success w/o Clinical Success

AVF Technical and Clinical Success

slide-2
SLIDE 2

ASDIN 7th Annual Scientific Meeting 2

Based on 2007 ERSD data, the annual cost per patient is:

$75,344 ($6278.66/mo) for a Catheter (7%) $72 729 ($6060 75/ ) f AV G ft (15%) $72,729 ($6060.75/mo) for a AV Graft (15%) $55,112 ($4592.66/mo) for a AV Fistula (4%)

At just under $60,000 $60,000, PPPY costs for patients with an AV FISTULA FISTULA are 18-25% lower than those for patients with a catheter or graft. ACCESS EVENT ACCESS EVENT costs are $5,960 & $7,451 per person per year for patients with a catheter or AV graft, compared to $3,194 for those with an AV fistula.

Based on 2007 ERSD data

Costs for vascular access services performed by nephrologists continue to rise, &, at $19 PPPY in 2007, were nearly 10 TIMES 10 TIMES greater than in 2000.

Secondary Patency

Study n Mean AVF age, range(months) Treatment 3-mon. 6-mon. 12-mon. 24-mon. 36-mon. Turmel- Rodrigues ’01 52 2.6 (1–6.5 ) PTA only 88% 83% 79% 75% N/A Beathard ’99 63 5 (1.1–14 ) PTA +/− Sg occl 82.5% 78% 74.7% Nassar ’06 119 8.9 (3-14.8 ) PTA +/− Sg occl 100% 100% 95% N/A N/A Falk ’06 65 10.6 (0.4-38 ) PTA +/− Sg occl 73% 72% 68% Miller ‘09 Class 1 39 25 (0.25–44 ) PTA, coil occl, LiCE, Fr 96% 96% 92% 53% 42% Miller ‘09 Class 2 58 94% 91% 76% 61% 32%

Techniques

  • Flow Rerouting with Elimination of

Competing Branch Veins

  • Staged Sequential Dilation
  • Long Length Balloon PTA
  • Limited Controlled Extravasation

Thrombectomy Maturation Step1: Find the Anastamosis

Directional Guidance Rotate Guiding Catheter

slide-3
SLIDE 3

ASDIN 7th Annual Scientific Meeting 3

Wire Guided Flow Rerouting

Demonstrate Basilic Vein Pathway using 0.018 Guiding Catheter

Wire Guided Selective Catheterization

Confirm Basilic Outflow Vein

Confirm Lumen

Find Point of Greatest Stenosis

Dilate in 1mm Increments until 6mm using Long Length Balloons Retrograde Access Using Balloon Puncture Technique

Dilate Inflow Stenosis

Fully Efface all Stenoses and Restore Flow

Restore Flow / Troubleshoot

Forearm Flow / Check for Perforations Upper Arm Flow / Check for Unimpeded Drainage

Eliminate Problematic Collateral Veins

Retrogr Retrograde Colla Collate terals Ante Antegrade Colla llaterals

slide-4
SLIDE 4

ASDIN 7th Annual Scientific Meeting 4

Dilate Using Inflow Control

  • Using Manual Pressure at the

anastamosis

  • Protect torn distal vein

segments from arterial inflow pressure during re‐angioplasty

  • f proximal segments
  • Avoid exposing injured distal

segments to high arterial pressure during periods of balloon occlusion

Final Inspection Follow‐up at 2 weeks

Before 2nd Ballooning After 2nd Ballooning

Follow‐up at 4 Weeks

Things don’t always go so well….. g y g Sometimes BAM = BOOM

slide-5
SLIDE 5

ASDIN 7th Annual Scientific Meeting 5 Sal Salvage the e the Sal Salvage Pro Proced edure

  • prolonged angioplasty
  • stent placement

Figure 1: Patient attrition flowchart.

Age – Mean, Range (years) 63.6 (17‐88) Male gender (%) 67 Diabetes mellitus (%) 61 Hypertension (%) 91 Fistula Type, n (%) Radial‐cephalic

69 (49)

Brachial‐cephalic

39 (28)

Table 1: Patient Demographics

Brachial‐basilic 4 (3) Brachial‐transposed basilic 26 (19) Brachial‐antecubital 1 (1) Ulnar‐basilic 1 (1) Average fistula age at time of first intervention (months)

5.6

Thrombosis Duration – Mean, Range (weeks) 3 (1‐12) Average Midbody Fistula Diameter Prior to Initial ntervention

1.5mm

Length of Thrombosed Vein Segment – Mean, Range (cm)

15 (5‐35) BBF (n = 24) BCF (n = 29) FF (n = 55) Percentage of Fistulas Requiring Arterial Angioplasty 2% 3%

24%

Percentage of Fistulas Requiring

Table 2: Thrombectomy Statistics for 108 Fistulas

Percentage of Fistulas Requiring Angioplasty of the Anastomosis 4% 21% 54% Percentage of Fistulas With Venous Perforation or Elastic Recoil Requiring Stent Placement

33%

21% 2% Abbreviations Used: AVF=arteriovenous fistula, BBF=brachiobasilic fistula, BCF=brachiocephalic fistula, FF=forearm fistula

Figure 2: Primary Access Patencies of Forearm, Brachial‐basilic, and Brachial‐cephalic Fistulas Figure 3: Primary Assisted Patencies of Forearm, Brachial‐basilic, and Brachial‐cephalic Fistulas

slide-6
SLIDE 6

ASDIN 7th Annual Scientific Meeting 6

Figure 4: Secondary Access Patencies of Brachial‐basilic, Brachial‐cephalic, and Forearm Fistulas

Time (Months) All AVFs (n = 108) BBF (n = 24) BCF (n = 29) FF (n = 55) Primary Access Patency 3 54% 50% 40% 63% 6 29% 13% 22% 41% Primary Assisted 6 78% 73% 77% 80%

Table 3: Follow‐Up Statistics for 108 Matured Fistulas

Patency 12 59% 49% 52% 66% Secondary Access Patency 12

90% 95% 84% 92%

24 80% 95% 74% 79% Post‐Maturation Interventions Per Access‐year

2.78 3.56 3.46 2.03

Post‐Maturation Thrombectomies Per Access‐year

0.52 0.64 0.72 0.35

Abbreviations Used: AVF=arteriovenous fistula, BBF=brachiobasilic fistula, BCF=brachiocephalic fistula, FF=forearm fistula

What does it COST ?

$12,904 = cost of maturation process based on presented data and Medicare reimbursement rates + $9,496 = cost of 46 days of catheter use during average maturation period + $48,166 = [ (365 − 46 days of fistula use) ÷ 365] × ($55,112 per patient per year cost of fistula) $70,566 = total cost per patient for the first year following the initial referral for the percutaneous route

Cost calculations: Percutaneous salvage: New access placement (assuming maturation time of 3 months): New access placement (assuming maturation time of 9 months):

$15,359 = cost of surgery + $18,836 = cost of 3 months of catheter usage according to USRDS data + $41,334 = cost of 9 months of fistula usage according to USRDS data $75,529 = total cost per patient for the first year following the initial referral for the surgical route $15,359 = cost of surgery + $56,509 = cost of 9 months of catheter usage according to USRDS data + $13,778 = cost of 3 months of fistula usage according to USRDS data $85,646 = total cost per patient for the first year following the initial referral for the surgical route

CONCLUSION: Thrombectomy Maturation

  • Thrombectomy Maturation

– Allows for the use of suboptimal veins – Dilation of the vein results in full thickness rupture of the vein wall, allowing primarily pressure to continue the dilation process the dilation process – As long as elevated flow and pressure are present, in the absence of competing branch veins, the AVF will dilate rather than sclerose. – 99/148 AVF’s functioning at 12 months. – Results in significant cost savings over abandonment and revision (even in best case abandonment scenario).

At just under $60,000 $60,000, PPPY costs for patients with an AV FISTULA FISTULA are 18-25% lower than those for patients with a catheter or graft. ACCESS EVENT ACCESS EVENT costs are $5,960 & $7,451 per person per year for patients with a catheter or AV graft, compared to $3,194 for those with an AV fistula. Costs for vascular access services performed by nephrologists continue to rise, &, at $19 PPPY in 2007, were nearly 10 TIMES 10 TIMES greater than in 2000.

slide-7
SLIDE 7

ASDIN 7th Annual Scientific Meeting 7

Radial Artery Angioplasty

  • L. Turmel‐Rodrigues et al;

Nephrol Dial Transplant (2009) 24: 3782‐3788

Preemptive PTA Allows for use of Suboptimal Veins

Based on 2007 ERSD data, the annual cost per patient is:

$75,344 ($6278.66/mo) for a Catheter $72 729 ($6060 75/ ) f G ft $72,729 ($6060.75/mo) for a Graft $55,112 ($4592.66/mo) for a Arteriovenous Fistula

Total Medicare costs rose 7.0% in 2007, to $410 BILLION $410 BILLION. . Costs for ESRD rose 6.1 percent, to 23.9 billion – 5.8% 5.8% of the Medicare budget. In 2007, total Medicare costs were $17.6 BILLION $17.6 BILLION for hemodialysis, and $1.9 BILLION $1.9 BILLION for transplant.

For new Medicare ESRD patients in 2006, costs rose

Based on 2007 ERSD data

from $6,056 $6,056 in the month prior to initiation to $14,761 $14,761 in the month following.

At just under $60,000 $60,000, PPPY costs for patients with an AV FISTULA FISTULA are 18-25% lower than those for patients with a catheter or graft. ACCESS EVENT ACCESS EVENT costs are $5,960 & $7,451 per person per year for patients with a catheter or AV graft, compared to $3,194 for those with an AV fistula.

Based on 2007 ERSD data

Costs for vascular access services performed by nephrologists continue to rise, &, at $19 PPPY in 2007, were nearly 10 TIMES 10 TIMES greater than in 2000.

X=5 1 2 3 4 5 6 7 8 9 10 11 12 13 14 15 16 AVF 6278.66 12557.32 18835.98 25114.64 31393.3 35985.96 40578.62 45171.28 49763.94 54356.6 58949.26 63541.92 68134.58 72727.24 77319.9 81912.56 Graft 6060.75 12121.5 18182.25 24243 30303.75 36364.5 42425.25 48486 54546.75 60607.5 66668.25 72729 78789.75 84850.5 90911.25 96972

LEGEND

Fistula Matures at X mo AVF Rate Applied at X+1 mo Catheter Rate Applied for 0-X mo AVF is cheaper than Graft at Y mo

Accumulative AVF AVF Monthly Monthly Cost Cost v. Accumulative Graft Graft Monthly Monthly Cost Cost, Based on Various Time Lengths of AVF Development

X=6 1 2 3 4 5 6 7 8 9 10 11 12 13 14 15 16 AVF 6278.66 12557.32 18835.98 25114.64 31393.3 37671.96 42264.62 46857.28 51449.94 56042.6 60635.26 65227.92 69820.58 74413.24 79005.9 83598.56 Graft 6060.75 12121.5 18182.25 24243 30303.75 36364.5 42425.25 48486 54546.75 60607.5 66668.25 72729 78789.75 84850.5 90911.25 96972

X=7

1 2 3 4 5 6 7 8 9 10 11 12 13 14 15 16 AVF 6278.66 12557.32 18835.98 25114.64 31393.3 37671.96 43950.62 48543.28 53135.94 57728.6 62321.26 66913.92 71506.58 76099.24 80691.9 85284.56 Graft 6060.75 12121.5 18182.25 24243 30303.75 36364.5 42425.25 48486 54546.75 60607.5 66668.25 72729 78789.75 84850.5 90911.25 96972 X=8 1 2 3 4 5 6 7 8 9 10 11 12 13 14 15 16 AVF 6278.66 12557.32 18835.98 25114.64 31393.3 37671.96 43950.62 50229.28 54821.94 59414.6 64007.26 68599.92 73192.58 77785.24 82377.9 86970.56 Graft 6060.75 12121.5 18182.25 24243 30303.75 36364.5 42425.25 48486 54546.75 60607.5 66668.25 72729 78789.75 84850.5 90911.25 96972 X=9 1 2 3 4 5 6 7 8 9 10 11 12 13 14 15 16 AVF 6278.66 12557.32 18835.98 25114.64 31393.3 37671.96 43950.62 50229.28 56507.94 61100.6 65693.26 70285.92 74878.58 79471.24 84063.9 88656.56 Graft 6060.75 12121.5 18182.25 24243 30303.75 36364.5 42425.25 48486 54546.75 60607.5 66668.25 72729 78789.75 84850.5 90911.25 96972