
SLIDE 1
9/7/2012 1
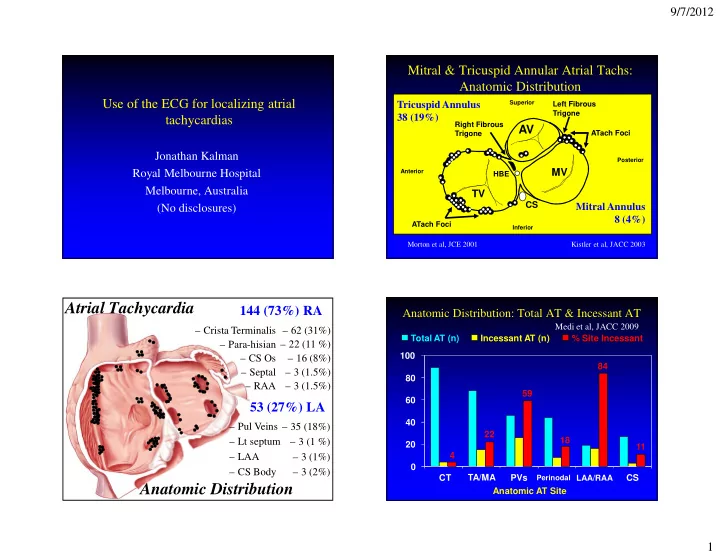
Use of the ECG for localizing atrial tachycardias
Jonathan Kalman Royal Melbourne Hospital Melbourne, Australia (No disclosures)
– 62 (31%) – 22 (11 %) – 16 (8%) – 3 (1.5%) – 3 (1.5%)
144 (73%) RA
– 35 (18%) – 3 (1 %) – 3 (1%) – 3 (2%) – Pul Veins – Lt septum – LAA – CS Body
53 (27%) LA
Atrial Tachycardia Anatomic Distribution
– Crista Terminalis – Para-hisian – CS Os – Septal – RAA
Superior Inferior Posterior Anterior
TV
CS
HBE
MV
AV
Left Fibrous Trigone Right Fibrous Trigone ATach Foci
- ATach Foci
Mitral & Tricuspid Annular Atrial Tachs: Anatomic Distribution
Kistler et al, JACC 2003 Morton et al, JCE 2001
Tricuspid Annulus 38 (19%) Mitral Annulus 8 (4%)
Incessant AT (n)
Anatomic Distribution: Total AT & Incessant AT
Anatomic AT Site 20 40 60 80 100 CT TA/MA PVs
Perinodal LAA/RAA