
SLIDE 1
An Australian gold miner - for global investors Pogo Site Visit - - - PowerPoint PPT Presentation
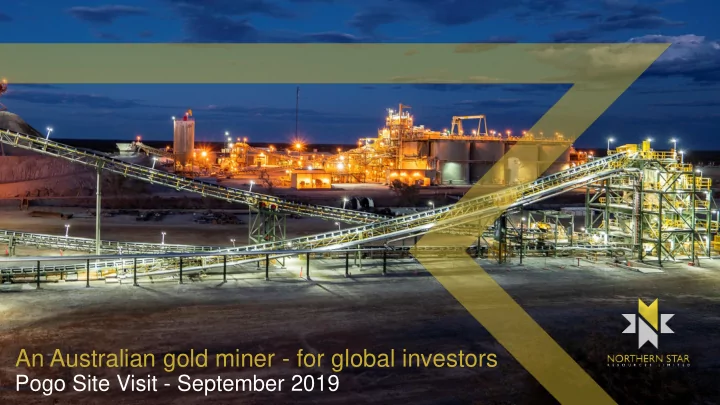
An Australian gold miner - for global investors Pogo Site Visit - September 2019 Resources & Reserves and Forward Looking Statements Mineral Resources and Ore Reserves The Mineral Resources and Ore Reserves information reported in accordance
2
Mineral Resources and Ore Reserves The Mineral Resources and Ore Reserves information reported in accordance with the 2012 edition of the Joint Ore Reserves Committee’s Australasian Code for Reporting of Mineral Resources and Ore Reserves ("JORC Code") in this presentation for all the Company’s projects is extracted from the reports entitled “Resource and Reserve Update” dated 1 August 2019, and “Pogo Plant Expansion and Goodpaster Exploration” dated 16 September 2019, available at www.nsrltd.com and www.asx.com. For the purposes of ASX Listing Rule 5.23, Northern Star confirms that it is not aware of any new information or data that materially affects the information included in the original market announcements and that all material assumptions and technical parameters underpinning the estimates in the relevant market announcements continue to apply and have not materially changed. Northern Star confirms that the form and context in which the Competent Person’s findings are presented have not been materially modified from the original market announcements. The information in this announcement relating to the Pogo mine's mineral resources for the period before 16 October 2018 is reported in accordance with the requirements applying to foreign estimates in the ASX Listing Rules and, as such, is not reported in accordance with the JORC Code. The information is extracted from the ASX announcement entitled “Northern Star acquires Pogo Gold Mine in Alaska” dated 30 August 2018. The Pogo resources mentioned in this announcement for the period before 16 October 2018 are estimated as at 31 December 2017 and according to the Canadian NI 43-101 standards, but are not fully compliant with those standards. A cautionary statement in respect of such resources appears in the Company’s ASX announcement dated 30 August 2018. The information in this announcement relating to the Pogo mine's reserves for the period before 1 August 2019 is reported in accordance with the requirements applying to foreign estimates in the ASX Listing Rules and, as such, is not reported in accordance with the JORC Code. The information is extracted from the ASX announcement entitled “Northern Star acquires Pogo Gold Mine in Alaska” dated 30 August 2018. The Pogo reserves mentioned in this announcement for the period before 1 August 2019 are estimated as at 31 December 2017 and according to the Canadian NI 43-101 standards, but are not fully compliant with those standards. A cautionary statement in respect of such reserves appears in the Company’s ASX announcement dated 30 August 2018. Forward Looking Statements Northern Star Resources Limited has prepared this announcement based on information available to it. No representation or warranty, express or implied, is made as to the fairness, accuracy, completeness or correctness of the information, opinions and conclusions contained in this announcement. To the maximum extent permitted by law, none of Northern Star Resources Limited, its directors, employees or agents, advisers, nor any other person accepts any liability, including, without limitation, any liability arising from fault or negligence on the part of any of them or any other person, for any loss arising from the use of this announcement or its contents or otherwise arising in connection with it. This announcement is not an offer, invitation, solicitation or other recommendation with respect to the subscription for, purchase or sale of any security, and neither this announcement nor anything in it shall form the basis of any contract or commitment whatsoever. This announcement may contain forward looking statements that are subject to risk factors associated with gold exploration, mining and production businesses. It is believed that the expectations reflected in these statements are reasonable but they may be affected by a variety of variables and changes in underlying assumptions which could cause actual results or trends to differ materially, including but not limited to price fluctuations, actual demand, currency fluctuations, drilling and production results, Resource and Reserve estimations, loss of market, industry competition, environmental risks, physical risks, legislative, fiscal and regulatory changes, economic and financial market conditions in various countries and regions, political risks, project delay or advancement, approvals and cost estimates. All currency conversions in this document were converted at a spot conversion rate of USD:AUD of 0.70
4
200 400 600 800 1,000 1,200 1,400 1,600
Total monthly development metres advance (excludes contractor metres)
76% increase with arrival
March-19
Average development metres from July-18 to Feb-19 of 797m Target of 1,500m per month
5
2 4 6 8 10 12 14 16 18 10,000 20,000 30,000 40,000 50,000 60,000 70,000 80,000 January February March April May June
Average Grade (gpt) Tonnes Mined (t)
Pogo tonnes mined by category Jan-June FY2019
Stoping tonnes Development tonnes LG (t) (1.7 - 4.3g/t) Stoping Grade Av Grade if LG removed
6
▪ Since acquisition, all-in sustaining cost (AISC) per tonne has reduced by 29%; this will reduce further as more areas are established and productivity rates improve further ▪ Transition to longhole stoping (LHS) is a key driver to the success at Pogo and is on track to transition to 60% of
▪ Previous method of cut & fill costs ~US$136/t mined compared to LHS at ~US$42/t mined; this equates to a saving of ~US$94/t mine, realising a 69% lower cost per stoping tonne ▪ New mining fleet now on site with leading-edge technologies, resulting in significantly improved productivities & substantially lower maintenance costs ▪ Current fleet has capacity to mine at 1.3Mtpa run-rate in 2020 as new mining areas are established and level layouts are modified to support LHS and high productivities
Cut & Fill at US$136/t LHS at US$42/t
100 150 200 250 300 350 400 FY19 - Q1 FY19 - Q2 FY19 - Q3 FY19 - Q4 Aug-19
Pogo AISC (USD) ($/t)
29% reduction in AISC per tonne since acquisition
7
8
▪ Current capacity of processing plant is 1.0Mtpa; only plant for over 200km ▪ Phase 2 expansion targets 1.3Mtpa run-rate by January 2021 with capital of ~US$30M ▪ Order of Magnitude cost estimate for Phase 3 expansion to 1.5Mtpa for an additional ~US$17M ▪ Cost per tonne reduction of ~25% with increased throughput ▪ Key piece of infrastructure to unlock district with a replacement value of over US$250M
0.0 0.2 0.4 0.6 0.8 1.0 1.2 1.4 1.6 1.8
Materials handling Grinding (55um- 65um) Gravity circuit Flotation Leach Elution Tailings - thickener and Filter press Reagents and site infrastructure
Throughput per annum (million metric tonnes)
Current capacity by area Phase 2 increase to 1.3Mtpa by area Phase 3 increase to 1.5Mtpa by area Current annual throughput (1.0Mt) Phase 2 Annual Throughput (1.3Mt) Phase 3 annual throughput (1.5Mt) US$2M US$2M US$20M US$6M US$1M US$7M US$9M
9
▪ Pogo is a world-class 10Moz gold endowment that has produced ~4Moz at an average grade of ~13gpt over the past 13 years at an average of ~300,000ozpa ▪ Pogo has a JORC Resource of 5.95Moz at 9.6gpt and a maiden JORC Reserve of 1.5Moz at 7.5gpt ▪ FY20 guidance of 200,000oz-240,000oz at an AISC US$850-US$925/oz (A$1,210-A$1,320/oz) (1H: 80,000-100,000oz; 2H: 120,000-140,000oz) ▪ NST’s proven business model of increasing production and delivering cost improvements is well underway ▪ Since acquisition, all-in sustaining cost per tonne has reduced by 29%; will reduce further as productivities improve ▪ Transition to longhole stoping is a key driver to the success and is on track to account for 60% of ore tonnes from 2020 onwards ▪ New mining fleet is on site resulting in significantly improved productivities & substantially lower maintenance costs ▪ Current fleet has capacity to mine 1.3Mtpa of ore as new mining areas are established and level layouts are modified to support long hole stoping
Pogo Endowment: ~10 Moz Current Resource: 5.95 Moz Current Reserve: 1.5 Moz
11
▪ The Pogo gold deposit is one of several Intrusion Related Gold Systems
(IRGS) in the central northern Cordillera spatially and temporally associated with the early to mid-Cretaceous magmatic belts and intrusive complexes
▪ The Tintina Gold Province (TGP) is an arcuate zone broadly defined by the Kaltag-Tintina fault
to the north and the Denali-Farewell fault to the south (~200km x ~1,200km)
▪ The TGP has a total gold endowment exceeding 70Moz of gold. Notable deposits include
Donlin Creek (Barrick / Novagold, >45Moz), Fork Knox (Kinross, ~10Moz), Pogo (NST, ~10Moz) and Dublin Gulch (Victoria Gold Corp., >3Moz)
▪ A series of at least 25 Early to Mid-Cretaceous (145Ma to 90Ma) plutons were emplaced
across the northern North American Cordillera (Hart, 2004). These were likely related to subduction and extension resulting from terrane collision Tintina Gold Province
CONTINENTAL SCALE TECTONO-ELEMENTARY SCALE PROVINCIAL SCALE REGIONAL SCALE
North America North American Cordillera Tintina Gold Belt Goodpaster District Pogo Mine
LOCAL SCALE
12
CONTINENTAL SCALE TECTONO-ELEMENTARY SCALE PROVINCIAL SCALE REGIONAL SCALE LOCAL SCALE
North America North American Cordillera Tintina Gold Belt Goodpaster District Pogo Mine
DEPOSIT CLASSIFICATION
Mesothermal quartz vein hosted intrusion related structurally-controlled gold deposit; Related to mid-cretaceous intrusive complex; Mineralisation dated at ~104M years
HOST ROCKS
Sillimanite-bearing paragneiss or orthogneiss that ranges in age from Proterozoic (>541Ma) to mid-Palaeozoic (Siluro-Devonian, ~375Ma); Proximal to Mid- Cretaceous granitoids and other associated intrusive rocks
MINERALISATION
(1) Quartz hosted stacked vein systems (Liese, Fun Zone, South Pogo, East Deeps); Flat to moderately dipping (25-45o) laminated to massive veins dipping towards the NW; Average grade of the deposit mined to date is 13.6gpt. Vein width varies from <0.5m to >10m (average ~3m) (2) Steeply east-dipping veins (~60-70o) within late stage north-striking fault zone (North Zone) (3) Sulphide associated gold as disseminated sulphides or in sulphide veinlets
SULPHIDE ASSEMBLAGES
Low sulphide content (<3%); Main sulphide species include pyrite, arsenopyrite, pyrrhotite and chalcopyrite. Mineralised zones may include trace amounts of loellingite, bismuth-tellurium sulphides, molybdenite, and
STRUCTURE
Multi-phase early stage brittle-ductile structures offset by late stage brittle faults with common dextral
adjacent to the FW contacts. Late stage north to north east trending
ALTERATION
Multi-phase variable alteration assemblages. Common alteration minerals include biotite, silica, sericite, dolomite and chlorite
13
* Gold In Circuit
2,000,000 4,000,000 6,000,000 8,000,000 10,000,000 2004 FS 2010 YE 2011 YE 2012 YE 2013 YE 2014 YE 2015 YE 2016 YE 2017 YE 2018 MY 2019 MY
Gold Ounces
CUMULATIVE PRODUCTION reserve (Non JORC) resource (Non JORC) RESERVE (JORC Compliant) RESOURCE (JORC Compliant)
ORE RESERVES As at 30 June 2019
CATEGORY Tonnes (‘000) Grade (gpt) Contained Au (‘000oz)
Proved
Probable 6,103 7.5 1,469 TOTAL 6,103 7.5 1,472
MINERAL RESOURCES
As at 30 June 2019 Inclusive of Reserve
CATEGORY Tonnes (‘000t) Grade (gpt) Contained Au (‘000oz)
Measured
Indicated 7,200 9.6 2,226 Inferred 12,128 9.5 3,720 TOTAL 19,328 9.6 5,949
POGO MID YEAR 2019 RESERVE & RESOURCE UPDATE
FEASIBILITY 4.9Moz Endowment ACQUISITION
14
20,000 40,000 60,000 80,000 100,000 120,000 140,000
2,000,000 3,000,000 4,000,000 5,000,000 6,000,000 7,000,000
2010 YE 2011 YE 2012 YE 2013 YE 2014 YE 2015 YE 2016 YE 2017 YE 2018 MY 2019 MY
Total Annual Drilling (m) Reserve Resource Ounces
RESERVE RESOURCE DRILL METRES (TOTAL)
2010-2014: INCREASED DRILLING = INCREASING RESOURCE TREND 2015-MY2018: DECREASED DRILLING = DECREASED R&R TREND POST NST ACQUISITION: R&R INCREASE CORRESPONDS WITH SIGNIFICANT INVESTMENT IN DRILLING
15
MY19 P&P ORE RESERVES
CATEGORY Tonnes (‘000) Grade (gpt) Au (‘000oz)
East Deeps 530 8.2 140 Fun Zone 470 8.0 120 Liese 3,513 7.7 866 South Pogo 942 6.8 205 North Zone
647 6.7 138
GIC
TOTAL 6,103 7.5 1,472
NORTH ZONE 647kt @ 6.6gpt for 138koz FUN ZONE 470kt @ 8.0gpt for 120koz EAST DEEPS 530kt @ 8.2gpt for 140koz SOUTH POGO 942kt @ 6.8gpt for 204koz LIESE 3,513kt @ 7.7gpt for 866koz MINED 2006-MY2019 ~3.9Moz N S E W 3,000ft (914m)
16
NORTH ZONE 2,387kt @ 8.8gpt for 678koz FUN ZONE 2,753kt @ 10.5gpt for 934koz EAST DEEPS 1,634kt @ 8.9gpt for 470koz SOUTH POGO 2,790kt @ 8.4gpt for 753koz LIESE 5,798kt @ 11.2gpt for 2,087koz
MY19 MINERAL RESOURCES
CATEGORY Tonnes (‘000) Grade (gpt) Au (‘000oz)
Central Veins
M&I Inferred
2,008
7.9
509
East Deeps
M&I Inferred
1,634
515 1,120
8.9
7.5 9.6
470
124 346
Fun Zone
M&I Inferred
2,753
398 2,354
10.5
12.8 10.2
934
164 770
Hill 4021
M&I Inferred
1,958
8.2
516
Liese
M&I Inferred
5,798
3,436 2,362
11.2
10.6 12.0
2,087
1,172 915
South Pogo
M&I Inferred
2,790
1,408 1,382
8.4
8.2 8.6
753
370 382
North Zone
M&I Inferred
2,387
1443 944
8.8
8.5 9.3
678
397 282
GIC
TOTAL
M&I Inferred
19,328
7,200 12,128
9.6
9.6 9.5
5,947
2,229 3,720
MINED 2006-MY2019 ~3.9Moz
* Calculated at US$1,300 and COG of 3.8gpt. Resources are inclusive of Reserves.
CENTRAL VEINS 2,008kt @ 7.9gpt for 509koz 3,000ft (914m) N S E W
17
POGO MINE AREA CENTRAL GOODPASTER LOWER LIESE
Stacked Vein System
Gold Produced to June 2019: ~4Moz 2019 Resource: 4.9Moz Maiden 2019 Reserve: 1.5Moz
Discovery
Maiden 2019 Resource 0.5Moz
Inadequately Tested Not Tested
Discovery Potential
Hill 4021 2019 Resource: 0.5Moz SOUTHERN EXTENSIONS
A A’
Inadequately Tested
18
LIESE ZONE VEINS
▪ Mineralised structures poorly drilled at margins ▪ Mineralisation remains open
A B A B
SOUTH POGO FUN ZONE
A B A B A B A B B
NORTH ZONE
A B A B
https://inventum3d.com/c/nsrltd/pogo
POGO 3D MODEL
19
GRID 1,000ft (305m) N S E W East Deeps South Pogo Liese North Zone Central Veins Fun Zone Mine Workings (June 2019)
Assay Grade
▪ 12.2Mt @ 9.5gpt for 3.7Moz in Inferred Resource
Assays as at June 2010
NZ 575 Probing
100ft (30.5m)
20
C1 C2 C3 C4 C4.5 C5 C6 SURFACE
Felsic Intrusion GRGN Orthogneiss Quartz Veining
Scale: 750ft / 229m
▪ FY2019 surface drilling focused on definition
▪ The maiden JORC (2012) Resource of 509koz @ 7.9gpt formed part of the MY19 estimate ▪ Interpretation shows an array of at least 6 stacked coherent mineralised veins, in addition to multiple structural offsets ▪ Orientation and location of mineralised veins (and potential linking structures) is influenced by pre-mineral felsic intrusions, with the main granitic gneiss (GRGN) body observed in the core of the Central Veins system ▪ Conceptual development to define and access the Central Veins has been designed
Central Vein Example: 18-009: 4.6m@8.3gpt
22
23 Liese Veins West Knoll South Pogo Fun Zone Central Lodes Goodpaster River Goodpaster Diorite Looking SE
Metres 250 500 750 G7 Structure G3 Structure G2 Structure G1 Structure
25
SHAW
INK
Soil Au (ppb)
20 30 40 50 150
10.0 2.5 5.0 7.5 km
Goodpaster Burn West Knoll Pogo Pogo South Star Ridge Star Vein Hill 4021 Theits Cholla Vn #1 Cholla Vn #2 Chorizo Keri Spring Tam Ridge Tam
26
IN K
Soil Au (ppb)
20 30 40 50 150 10.0 2.5 5.0 7.5 km
Pogo
SHAW SKIPPY
JORC 2012 Resource 0.5Mozs @ 8.2 gpt Au Historical rock chip sampling up to 115 gpt Au* Historical drilling returned 2.9m @ 21.6 gpt Au* Historical drill intercept of 1.3m @ 20 gpt Au*, exploration drilling in progress Historical rock chip sampling up to 18.8gpt Au*, no drill testing
*Pre NST Data
Burn Hill 4021 Theits Spring Cholla Goodpaster
27
SHAW
Brinks Trend SHAW SKIPPY FOG INK POGO CLAIM STONE BOY CLAIMS
28
Investor Enquiries: Luke Gleeson, Investor Relations Level 1, 388 Hay Street, Subiaco 6008 Western Australia T: +61 8 6188 2100 E: info@nsrltd.com W: www.nsrltd.com Inventum 3D Page Links click here