SLIDE 1
Alberta Municipal Benchmarking Initiative Transit
SLIDE 2 What is AMBI?
- 3 Alberta municipalities
- Grant from Alberta Municipal Affairs
- Collaboration to build a framework, develop benchmark definitions
and allow comparison
- Develop an ongoing benchmarking process of 9 service areas
SLIDE 3 Why Benchmarking?
A benchmark is an established point of reference against which things can be measured and compared
- Helps to tell the municipal ‘performance story’
- Sound business practice
- Share knowledge and best practices
- Identifies opportunities for change
- Encourages continuous improvement
- Demonstrates transparency and value for money
SLIDE 4 Two Definitions
Efficiency
- a measure of productivity: quantity
- often expressed in cost per unit
Effectiveness
- a measure of value or benefit of service: quality
- often expressed as percentage or rate
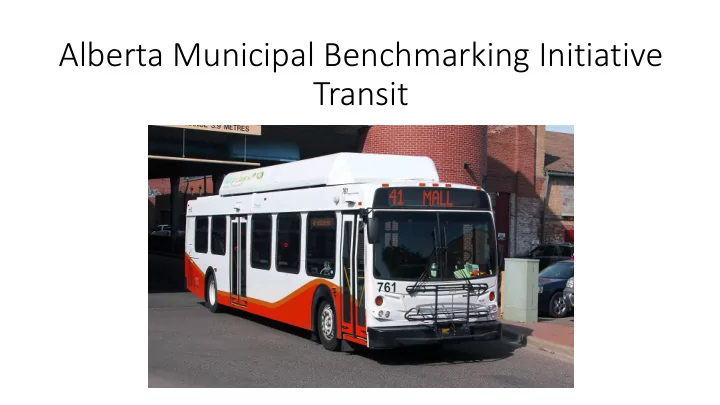
SLIDE 5 Transit
Last of the service areas to be benchmarked.
- Local Transit – Public transit along specific routes for set hours
- Specialized Services Transit – Small transit vehicles available to
qualified riders on request
- Regional Transit – Service that travels to and from the municipality
beyond the municipal boundaries
SLIDE 6 Transit
Municipality Local Specialized Regional Banff Lethbridge Medicine Hat
Regional transit operations are very different in each municipality and it was decided to not compare this service at this time.
SLIDE 7
Narrative Data
SLIDE 8
Narrative Data
SLIDE 9
Narrative Data
SLIDE 10
Transit Total Costs ($/capita or VAP) - Efficiency
$123
SLIDE 11
Specialized Services Cost vs Total Transit Cost (%) - Efficiency
19%
SLIDE 12
Local Transit Cost Recovery, Revenue to Total Costs Ratio (%) - Efficiency
26%
SLIDE 13
Specialized Services Cost Recovery, Revenue to Costs Ratio (%) - Efficiency
12%
SLIDE 14
Operating Expense ($/revenue hour) - Efficiency
$88
SLIDE 15
Total Vehicle Maintenance Costs vs Total Direct Costs (%) - Efficiency
16%
SLIDE 16
Local Transit Utilization (boardings/revenue hour) - Effectiveness
25
SLIDE 17
Local Transit Utilization (boardings/capita or VAP) - Effectiveness
20
SLIDE 18
Specialized Services Total Utilization (boardings/revenue hour) - Effectiveness
3.3
SLIDE 19
Specialized Services Total Utilization (boardings/population served) - Effectiveness
1.1
SLIDE 20 Transit – General Learnings
- Each municipality has different levels of service which make
comparisons difficult
- Need better participation to get full value of report
SLIDE 21 Future Considerations
- Determine ratio of cash fares vs single ticket vs media fares
- Trip performance – trips on time vs total trips
- Regional transit performance
- Boardings vs total bus capacity
- # of seats multiplied by the loading factor % (riders seated + standing)
- Get more municipalities participating to get better information
SLIDE 22
Questions?